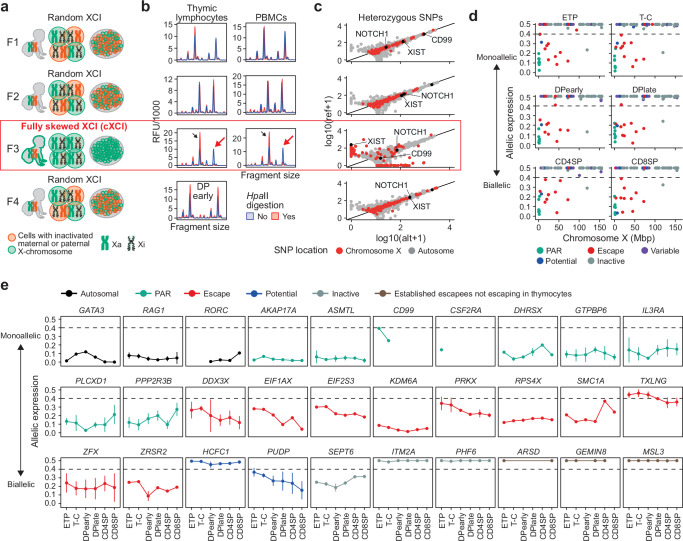
Fig. 3. X-inactivation dynamics during human T cell development.
a Overview of X-chromosome inactivation (XCI) skewing in females included in the thymocyte data set with schematic representation of active (Xa) and inactive (Xi) X-chromosomes. b HUMARA assay of Female 1 (F1), F2 and F3 in thymic lymphocytes and peripheral blood mononuclear cells (PBMCs) and F4 in early double positive (DPearly) cells. Black arrows show peak detection in digested and undigested DNA and red arrows show complete loss of one allele after HpaII digestion (red) indicating complete XCI skewing (cXCI). c Allele-specific expression (ASE) of genes with heterozygous SNPs (hSNP) as expression from the reference (ref) and alternative (alt) allele from chromosome X and autosomal genes in F1, F2, F3 and F4. d ASE, chromosomal location and escape status of expressed X-chromosome genes with at least one hSNP in F3. e ASE of a selection of genes across thymocyte development in F3 (n = 1 for each thymocyte subpopulation). Dots and lines indicate mean and standard deviation, respectively. d, e XCI status defined based on previous assesment10 with potential XCI escape genes (blue) previously not investigated or classified as unknown. Source data are provided as a Source Data file.

