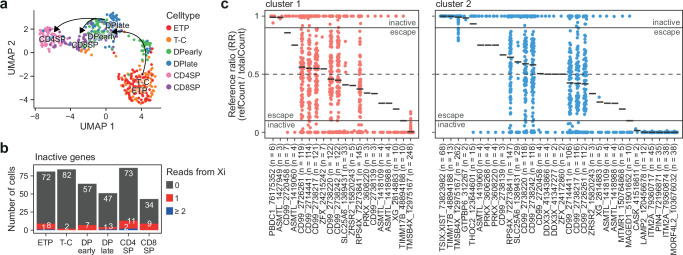
Fig. 5. Single cell sequencing of human thymocyte populations.
a UMAP visualization of thymocyte subpopulations from Smart-seq2 data. b Number of cells with 0, 1 or ≥ 2 reads from inactive genes on the inactive X-chromosome (Xi). c Reference ratio (RR, reference read count / total read count) of heterozygous SNP expression from single cells pooled based on clusters identified in Supplementary Fig. 6. Black lines indicate mean RR per gene and cluster. Only SNPs with RR not equal to 0 or 1 shown. Escape from X-inactivation: reference ratio: 0.1–0.9. n, number of cells for which expression of the SNP was detected. Numbers after gene symbols are the genomic position of the heterozygous SNP. Source data are provided as a Source Data file.

