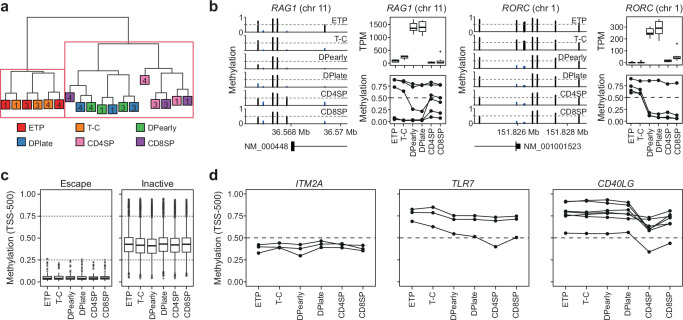
Fig. 6. DNA methylation on chromosome X is stable during T cell development.
a Hierarchical clustering of the 1000 most variable methylated sites in EPIC array methylation data from thymocyte populations in females F1, F3, and F4. Individuals indicated as numbers. b Methylation around transcription start sites (TSS) (left), gene expression as transcript per million (TPM) (top) and methylation of probes −500 and +1500 from TSS (bottom) in thymocyte subpopulation for genes involved in thymocyte development (RAG1 and RORC). Boxplot representing median (central line), first and third quartiles (Q1 and Q3, respectively) (box edges) and 1.5*inter quartile range (IQR) from Q1 and Q3 (whiskers) from three biological replicates (all female) are shown. c Boxplot representing median (central line), first and third quartiles (Q1 and Q3, respectively) (box edges) and 1.5*inter quartile range (IQR) from Q1 and Q3 (whiskers) of DNA methylation of all probes in −500 TSS range of escape (left) or inactive genes (right) from three biological replicates (all female), including only genes that are found to have the same XCI status in thymocytes and previous assessments10. Dashed lines highlight low (methylation ≥0.25), intermediate (0.26-0.75) and high ( > 0.76) DNA methylation. d DNA methylation at TSS −500 across thymocyte development for ITM2A, TLR7 and CD40LG. a, b, c, d, ETP, early T cell progenitors; T-C, T cell committed thymocytes; DPearly, early double positive thymocytes; DPlate, late double positive thymocytes; CD4SP, CD4 single positive thymocytes; CD8SP, CD8 single positive thymocytes. Source data are provided as a Source Data file.

