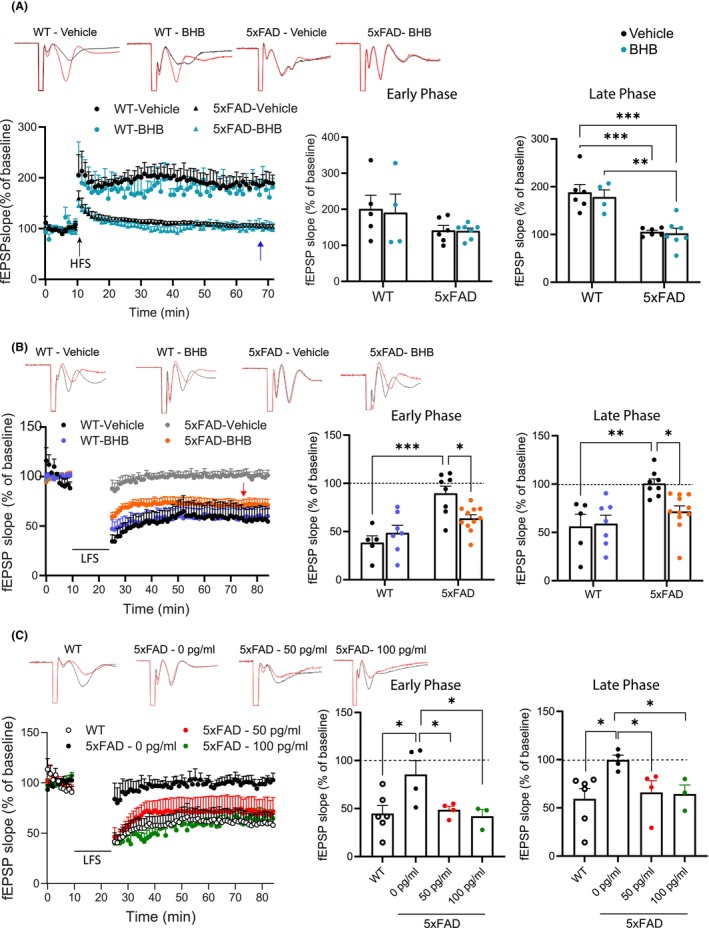
FIGURE 2.

BHB treatment rescues hLTD, but not hLTD, impairment in 5xFAD mice. Shown are representative traces, time course chart, and summary bar graphs of hLTP induced with high frequency stimulation (HFS) (A) or hLTD induced with low frequency stimulation (B, C). Representative traces show the fEPSP of baseline (black trace) and at 60 min (red trace) after stimulation. Summary bar graphs show the average fEPSP slope during the early phase (first 5 min after induction) and the late phase (between 50 and 60 min after induction). (A) BHB does not rescue hLTP impairment in 5xFAD mice. Group size: WT‐Vehicle = 5; WT‐BHB = 4; 5xFAD‐Vehicle = 6; 5xFAD‐BHB = 7. Two‐way ANOVA with Newman–Keuls's post‐hoc tests shows significant differences between genotypes in late phase (F(1,13) = 20.81, p < 0.001). (B) BHB mitigates hLTD impairment in 5xFAD mice. Group size: WT‐Vehicle = 5; WT‐BHB = 7; 5xFAD‐Vehicle = 8; 5xFAD‐BHB = 11. The blue arrow points to no improvement of 5xFAD hLTP by BHB. The red arrow points to the recovery of hLTD in 5xFAD mice by BHB. Two‐way ANOVA with Newman–Keuls's post‐hoc tests shows significant differences between genotypes in early phase (F(1,27) = 24.83, p < 0.001) and late phase F(1,27) = 13.79, p < 0.001. (C) Pre‐incubation with IL‐1β antibody mitigates hLTD impairment in 5xFAD mice. Group size: WT = 6; 5xFAD‐0 pg/mL (anti‐IL‐1β) = 4; 5xFAD‐50 pg/mL = 4: 5xFAD‐100 pg/mL = 3. Statistical analysis was performed by one‐way ANOVA with Newman–Keuls correction for multiple comparisons. Data are presented as mean ± SEM, *p < 0.05, **p < 0.01, ***p < 0.001.
