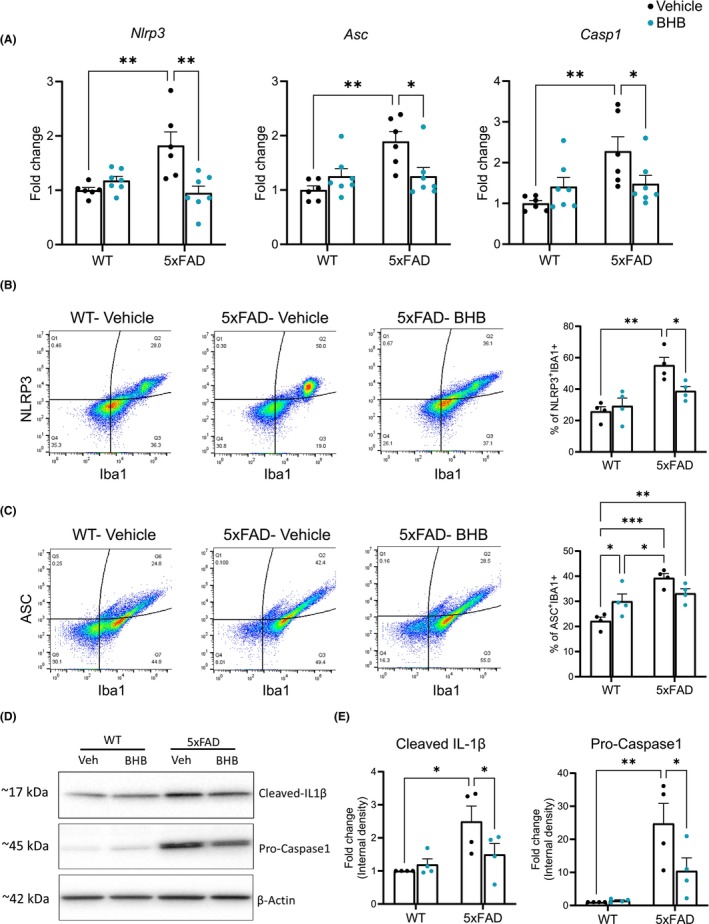
FIGURE 4.

BHB treatment reduces microglial NLRP3‐inflammasome formation in 5xFAD mice. (A) qPCR quantification of nlrp3, asc, and caspase1 RNA expression in acutely isolated microglia. Two‐way ANOVA with Newman–Keuls's post‐hoc tests shows significant differences between treatments in nlrp3 (F(1,22) = 6.019, p = 0.023); and significant differences between genotypes in nlrp3 (F(1,22) = 4.413, p = 0.047); asc (F(1,22) = 9.329, p = 0.006); and caspase1 (F(1,22) = 8.240, p = 0.009). (B) Flow cytometry quantification of NLRP3 in Iba1‐positive microglia. Shown are representative density plots and quantification of co‐localization for NLRP3 and Iba1 in dissociated brain cells. n = 4 per group. Two‐way ANOVA with Newman–Keuls's post‐hoc tests shows significant differences between genotype (F(1,12) = 23.20, p < 0.001). (C) Flow cytometry quantification of ASC in Iba1‐positive microglia. Shown are representative density plots and quantification of co‐localization for ASC and Iba1 in dissociated brain cells. n = 4 per group. Two‐way ANOVA with Newman–Keuls's post‐hoc tests shows significant differences between genotype (F(1,12) = 23.98, p < 0.001) (D, E) Representative images of Western blots for Cleaved IL‐1β and Caspase1 (D) and quantification of band intensity expressed as fold change (E). n = 4 per group. Two‐way ANOVA with Newman–Keuls's post‐hoc tests shows significant differences between genotype in cleaved IL‐1β (F(1,12) = 9.115, p = 0.011); and caspase1 (F(1,12) = 20.40, p < 0.001). Data are presented as mean ± SEM, *p < 0.05, **p < 0.01, ***p < 0.001.
