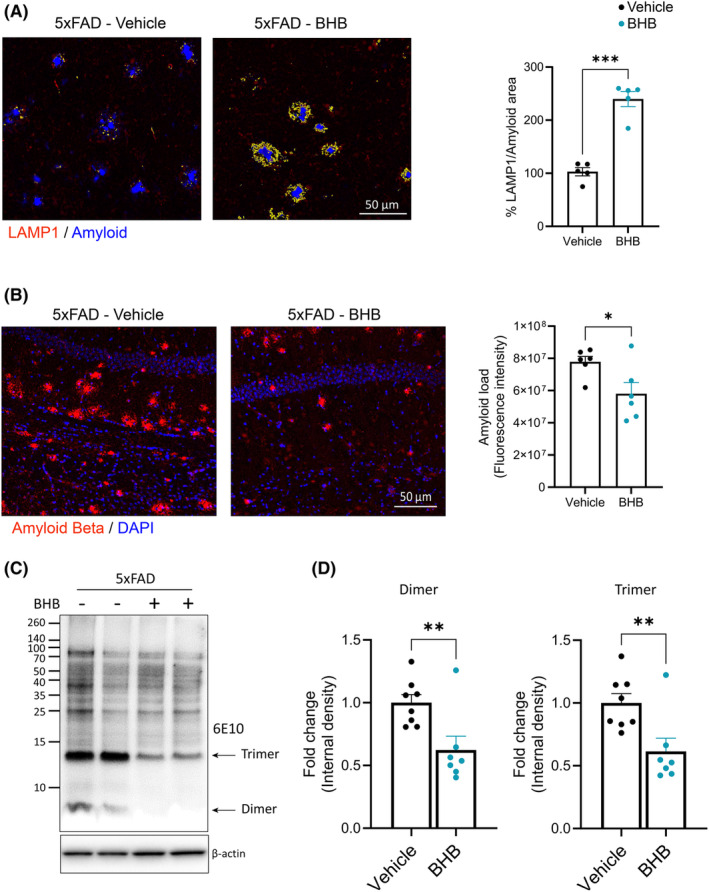
FIGURE 6.

BHB treatment enhances amyloid phagocytosis and reduces cerebral amyloid load in the 5xFAD brain. (A) Representative fluorescent images and quantification of the colocalization of LAMP1 (red) and amyloid plaques (FSB, Blue) staining in cerebral cortex. Co‐localization of LAMP1 and amyloid is highlighted in yellow. n = 4. (B) Representative fluorescent images from hippocampus co‐stained for Amyloid Beta (4G8, red) and DAPI (blue). Bar graph shows quantification of the amyloid load indicated by 4G8 immunoreactivity. n = 6 (C, D) Representative images of Western blots for β‐amyloid (clone 6E10) (C) and bar graphs showing quantification of the band intensity for Aβ dimer trimer, expressed as fold change (D). n = 8. Data are presented as mean ± SEM *p < 0.05, **p < 0.01, ***p < 0.001, unpaired t‐test.
