. 2024 Dec 5. Online ahead of print. doi: 10.1039/d4tb01334d

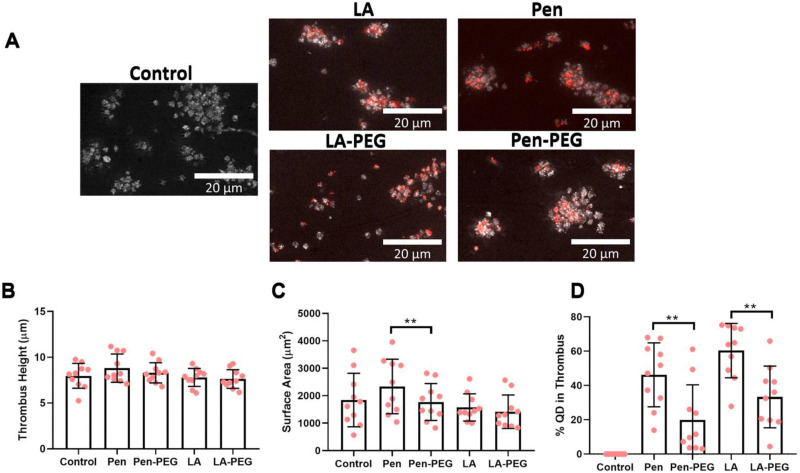
Fig. 8. Effect of PEGylated QDs on thrombus formation. Whole blood was stained with DiOC6, incubated with 100 nM of relevant QD for 20 min, and then flowed at 1000 s−1 arterial shear for 4 min over a microfluidic biochip pre-coated with 100 μg mL−1 collagen. The chip was fixed, then imaged with a fluorescence microscope using an NA 1.4 oil x63 objective. Representative images of thrombus formation with scale bars showing 20 μm shown in (A). Graphs show (B) thrombus height (μm), (C) thrombus surface area (μm2), and (D) percentage of QDs in platelets. Data is shown as mean ± SD. n = 10. Statistical significance was calculated using a one-way ANOVA followed by Tukey's multiple comparison post hoc test. *p ≤ 0.05, **p ≤ 0.01, ***p ≤ 0.001.

Fig. 8