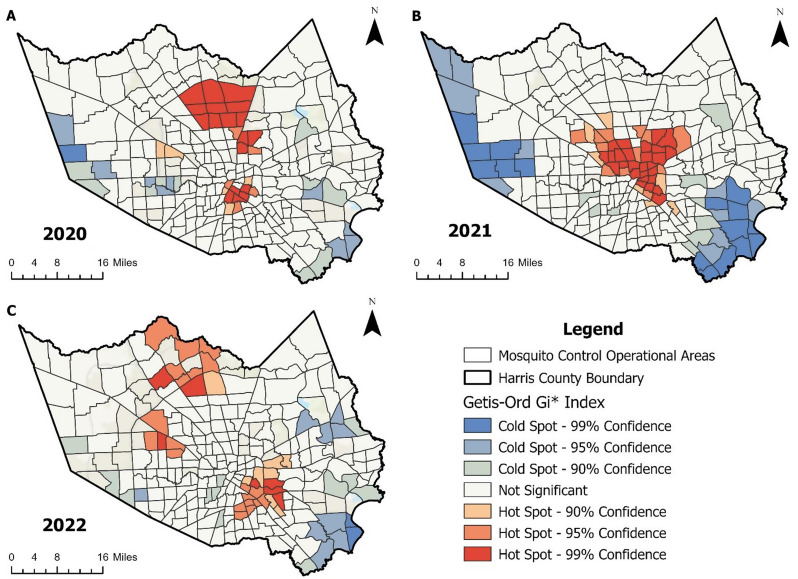
Fig. 4.
Changes in Hotspots by year for (A) 2020, (B) 2021, and (C) 2022. The Getis-Ord Gi* statistic identified significant clusters of high or low female Cx. quinquefasciatus normalized by trap-night within Mosquito Control Operational Areas. Hotspots and cold spots were determined using standard Z-score cut-offs. The number of hotspots and cold spots varied across years: 28 hotspots and 20 cold spots in 2020, 46 hotspots and 35 cold spots in 2021, and 35 hotspots and 23 cold spots in 2022. Analysis and mapping were conducted using ArcGIS Pro 3.2.0 (Esri, Redlands, CA)

