Fig. 8.

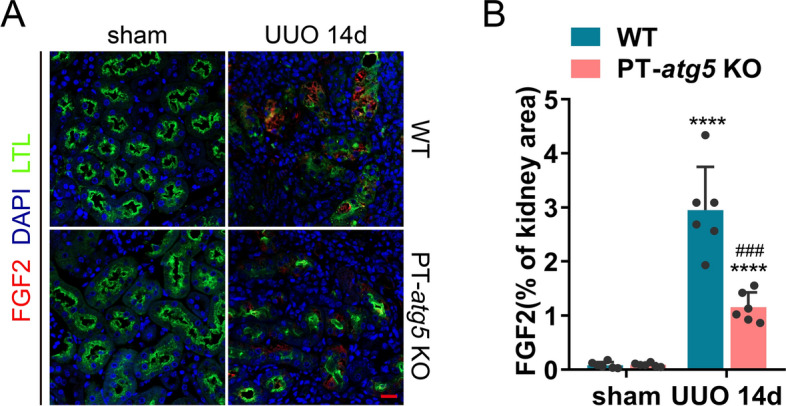
Atg5 deficiency suppresses FGF2 production in renal tubules during UUO. Kidneys subjected to sham or UUO surgery were collected on day 14, as shown in Fig. 7. A Representative images of immunofluorescence staining images with FGF2 antibody (red). The cell nuclei were labeled with DAPI (blue). Proximal renal tubules were stained with LTL (green). Scale bars, 20 μm. B Quantification of FGF2 positive stained areas. The values are expressed as mean ± SD (n = 6). * Indicates a significant difference from the sham group; # indicates a significant difference from the relevant wild-type group. # or *P < 0.05, ## or ** P < 0.01, ### or ***P < 0.001, #### or ****P < 0.0001
