Fig. 9.
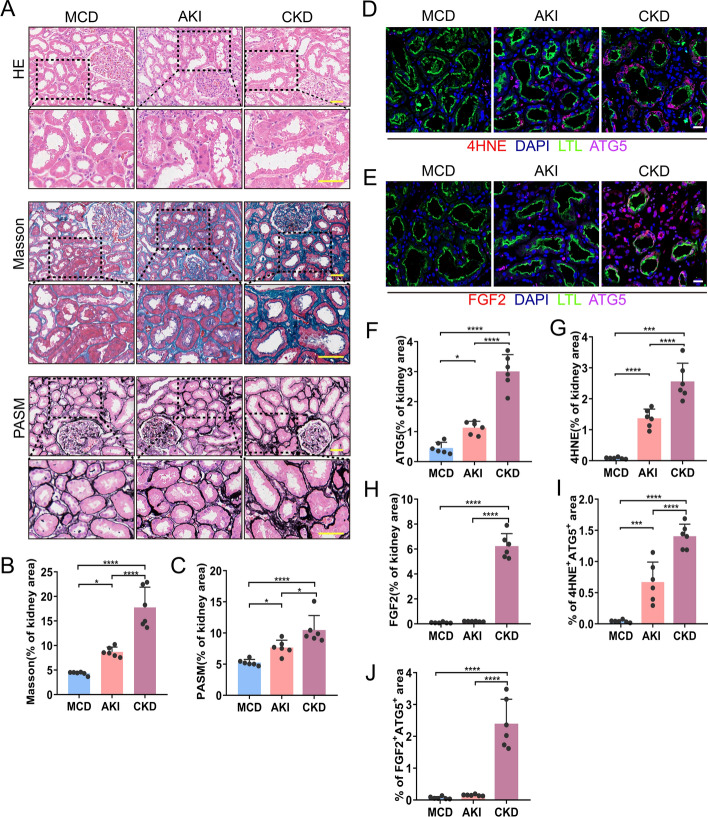
Increased induction of renal tubule autophagy, 4HNE, and FGF2 in renal biopsies in patients with AKI and CKD. Renal biopsies from patients with minimal change disease (MCD) as controls (n = 6), patients with AKI (n = 6), and patients with CKD (n = 6) were evaluated. A Representative images of H&E staining, Masson’s trichrome staining and PASM staining. Scale bars, 50 μm. B, C Quantitative analysis of Masson’s trichrome and PASM staining. D 4HNE (red) and ATG5 (violet) cells. E FGF2 (red) and ATG5 (violet) double immunofluorescence staining of the kidney sections. Cell nuclei were counterstained with DAPI (blue). Proximal renal tubules were stained with LTL (green). Scale bars, 20 μm. F Quantification of ATG5 positive area fraction. G Quantification of the 4HNE positive stained areas. H Quantification of FGF2 positive stained areas. I Quantification of 4HNE and ATG5 co-stained areas. J Quantification of FGF2 and ATG5 co-positive areas. The values are expressed as mean ± SD, *P < 0.05, **P < 0.01, ***P < 0.001, ****P < 0.0001

