
Figure 13:
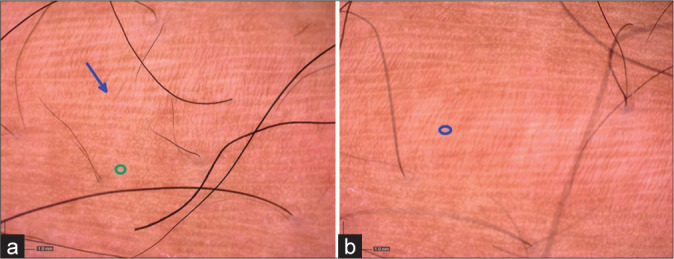
(a) Dermoscopy findings (magnification: ×35) of the stretch marks at the start of the study showing atrophic skin (blue arrow) with normal adjacent skin (green circle). (b) Dermoscopy findings (magnification: ×35) of the stretch marks at the end of study (20 weeks) show decrease in atrophy and pigmentation (blue circle).