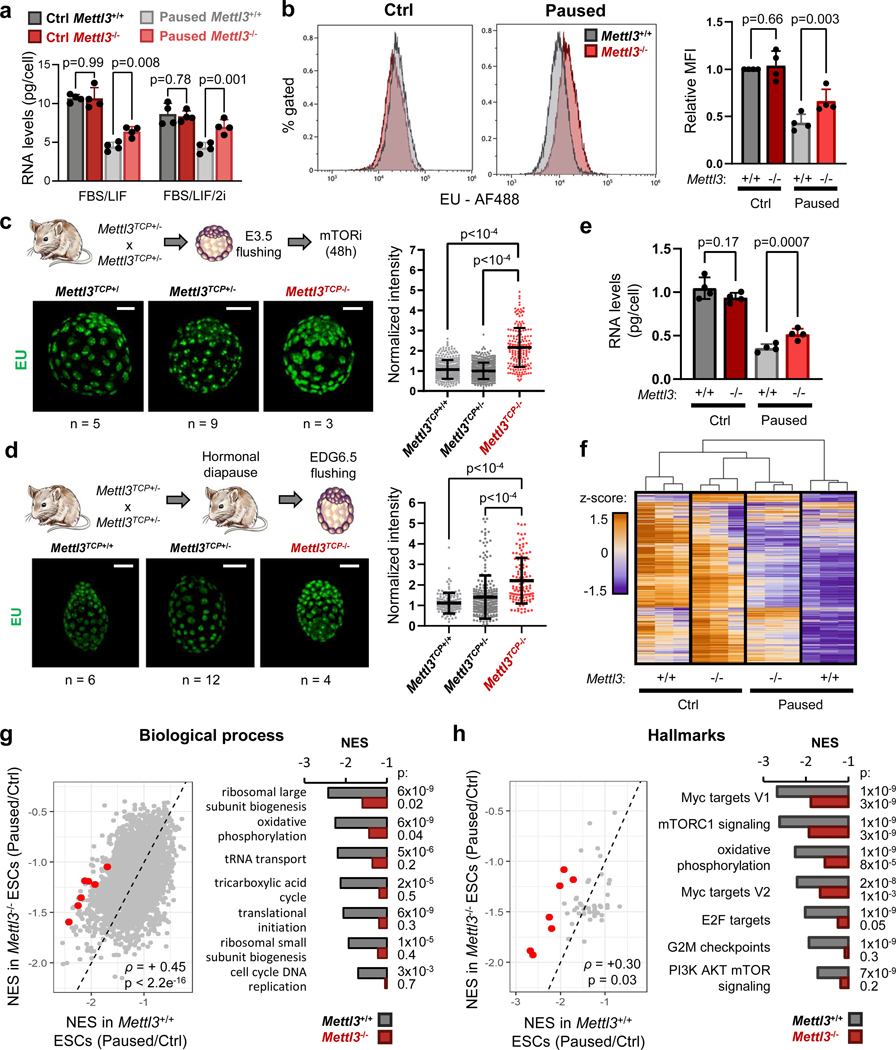
Figure 2: Mettl3 regulates hypotranscription in paused pluripotency.
a. Quantification of total RNA per cell in Mettl3+/+ and Mettl3−/− ESCs, grown in control and paused conditions, in FBS/LIF or FBS/LIF/2i media. Data are mean ± SD, n=4 biological replicates.
b. Representative histograms (left) of nascent transcription in Mettl3+/+ and Mettl3−/− ESCs grown in control or paused conditions and quantification (right) by median fluorescence intensity (MFI) relative to control Mettl3+/+ in each experiment, showing increased transcription in paused Mettl3−/− ESCs. Data are mean ± SD, n=4 biological replicates. Examples of FACS gating have been deposited on the Figshare repository (10.6084/m9.figshare.23551986). c-d. Immunofluorescence images and nuclear signal quantification of EU incorporation in ex vivo paused (c) and hormonally diapaused (d) blastocysts, showing increased nascent transcription in Mettl3TCP−/−. Data are mean ± SD. Number of embryos (n) as indicated, with scale bar at 50μm. e. Quantification of poly(A) RNA per cell in Mettl3+/+ and Mettl3−/− ESCs, grown in control and paused conditions. Data are mean ± SD, n=4 biological replicates. f. Heatmap of gene expression (by RNA-seq) for all genes expressed in Mettl3+/+ or Mettl3−/− ESCs, showing defective hypotranscription in paused Mettl3−/− ESCs. Data as z-score normalized per gene, with all samples displayed (n=3 biological replicates per group). g-h. Gene set enrichment analysis (GSEA) of gene expression changes in paused Mettl3+/+ and Mettl3−/− ESCs (as shown in Fig. 2f), using the “GO biological processes” (g) and “hallmarks” collections (h). Scatter plots (left) of the normalized enrichment scores (NES), with Spearman correlation coefficient (ρ). Representative pathways with defective hypotranscription in Mettl3−/− (red dots) are highlighted (right).
P-values (as indicated on figure) by two-tailed paired Student’s t-tests (a-b, e), one-way ANOVA with Dunnett’s multiple comparison test (c-d), two-sided pre-ranked gene set enrichment analysis with Benjamini-Hochberg FDR correction (f-g).

