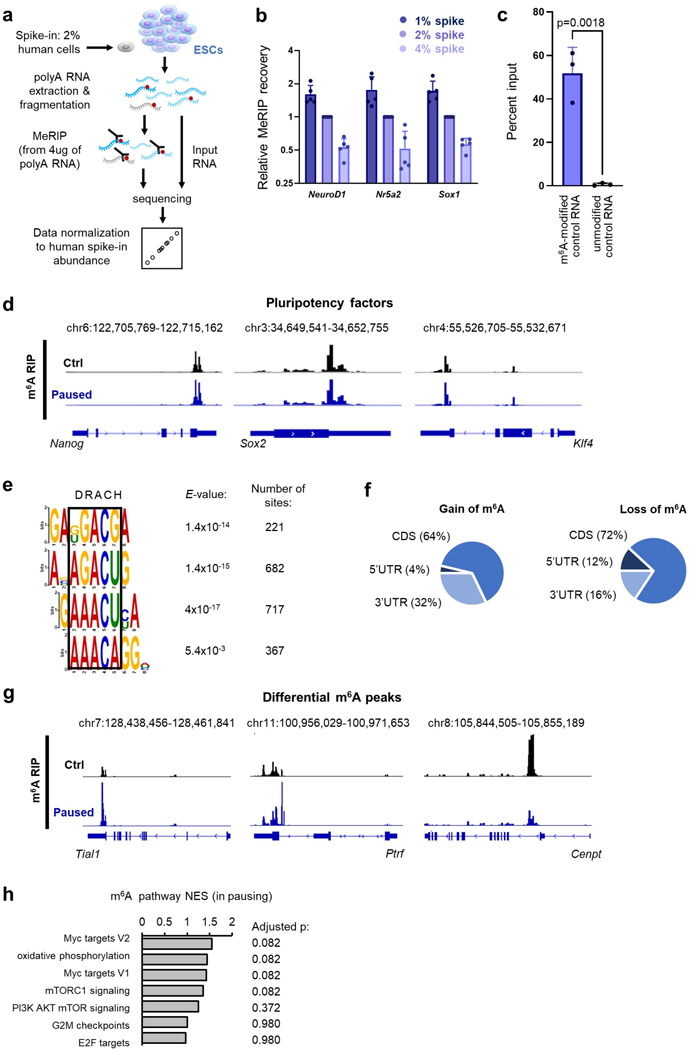
Extended Data Figure 3. Mapping m6A distribution in the transcriptome of paused ESCs.
a. Strategy for MeRIP-seq in ESCs with cell number-normalization (CNN) using human cell spiking. b. Validation of the CNN strategy for the MeRIP-seq. By mixing different ratios of human cells to ESCs (1, 2 or 4%), we simulated global changes in methylation. Spiking normalization allows capture of these differences, as shown here by MeRIP-qPCR for 3 methylated mRNAs (NeuroD1, Nr5a2, Sox1). Data are mean ± SD, n=5 biological replicates with levels relative to 2% spike in each replicate. c. The specificity of the m6A capture was tested by spiking poly(A) RNA from ESCs with exogenous RNAs before performing MeRIP-qPCR. Data are mean ± SD, n=3 biological replicates. P-values (as indicated on figure) by two-tailed unpaired Student’s t-tests. d. Examples of gene track views of MeRIP-seq, for mRNAs of pluripotency factors previously shown to be methylated in ESCs. e. Motif analysis performed with DREME in a 100bp window surrounding MeRIP peak summits identifies several motifs corresponding to the consensus “DRACH” m6A motif (where D=A, G or U; H=A, C or U). f. Distribution of differential m6A peaks, according to the type of structural element within the transcript. g. Examples of gene track views of MeRIP-seq, for mRNAs with significant hypermethylation (Tial1, Ptrf) or hypomethylation (Cenpt) in pausing of ESCs. h. GSEA of m6A changes in paused ESCs relative to control ESCs, using the “hallmarks” collection. No single pathway is significantly enriched based on m6A changes (representative pathways are shown). P-values (as indicated on figure) by two-sided pre-ranked gene set enrichment analysis with Benjamini-Hochberg FDR correction.

