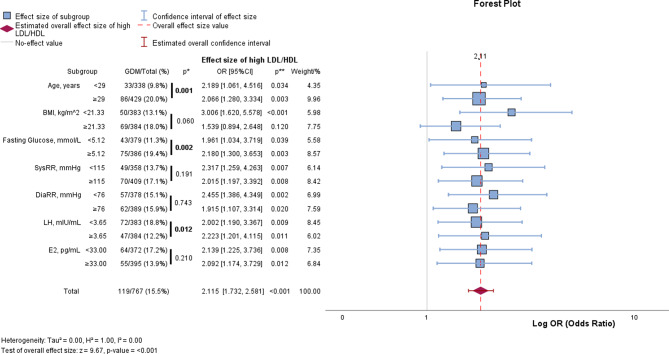
Fig. 3.
Forest plot – subgroup analysis of GDM prevalence and the association between LDL/HDL ratio and GDM. The first part of the table shows the prevalence of GDM in each of the subgroups. p* = represents the significance of a difference in GDM rate between the subgroups, calculated using the Chi-squared test. OR and p** show the effect size of a high LDL/HDL ratio (cut-off calculated using the Youden-Index) on the GDM rate in each of the subgroups. Abbreviations BMI = body mass index; CI = confidence interval; DiaRR = diastolic blood pressure; E2 = estradiol; GDM = gestational diabetes mellitus; LDL = low-density lipoproteins; LH = luteinizing hormone; HDL = high-density lipoproteins; N = no GDM; OR = odds ratio; SysRR = systolic blood pressure

