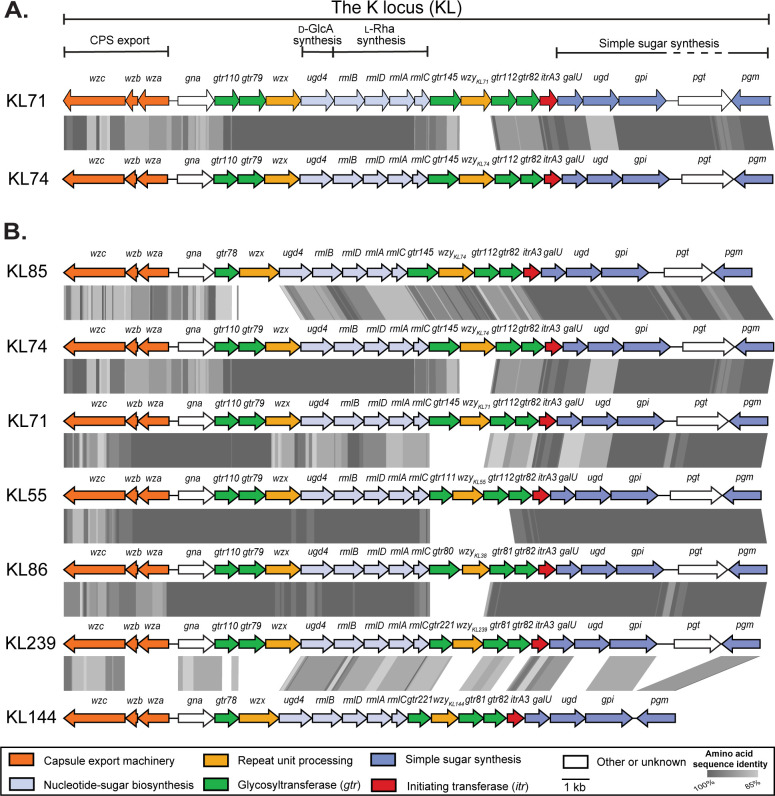
Fig 1.
Organization of the KL71 locus and related K loci. Genes drawn as arrows are colored according to predicted functions of gene products as indicated by the scheme below. Gray shading indicates regions of >85% amino acid sequence identity between predicted proteins determined by tBLASTx using EasyFig v.2.2.2 (13). (A) Comparison of KL71 with KL74. (B) Comparison of KL sequences from isolates producing CPS related to K71. Figure annotated in Adobe Illustrator. Figure drawn to scale using sequences available in the A. baumannii KL reference sequence database (14).

