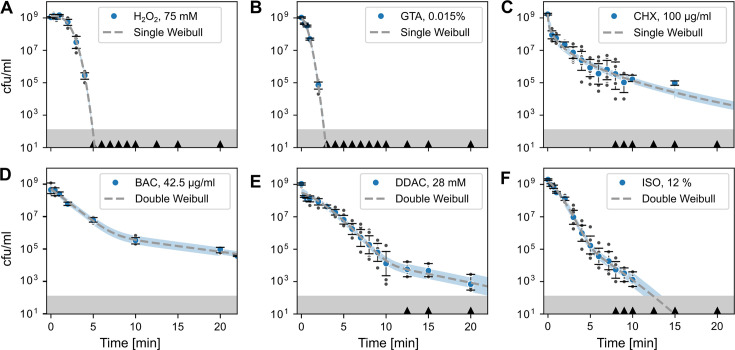
Fig 1.
Phenotypic heterogeneity affects disinfection kinetics. Disinfection time–kill kinetics of E. coli exposed to different disinfectants and fit by Weibull distributions (dashed line). Data in panels (A) to (C) are best fitted with a single Weibull model (Equation 2), whereas data in panels (D) to (F) are best fitted with a double Weibull model (Equation 3). Blue circles indicate the geometric mean of the time–kill experiments; error bars indicate the 95% CI obtained by bootstrapping. Dark gray circles are datapoints of individual experiments (in some panels, individual data points are overlayed by the data point displaying the geometric mean). Black triangles on the x-axes indicate when zero counts were present. Blue shaded areas indicate the 95% CI of the model fit (dashed line) to the experimental data, excluding values with zero counts. The gray shaded area at the bottom indicates the detection limit. Number of biological replicates n = 6, except for H2O2 where n = 5 and BAC where n = 3 biological replicates. (A) H2O2; (B) GTA; (C) CHX; (D) BAC; (E) DDAC; (F) ISO. Source data are provided in Dataset S1.

