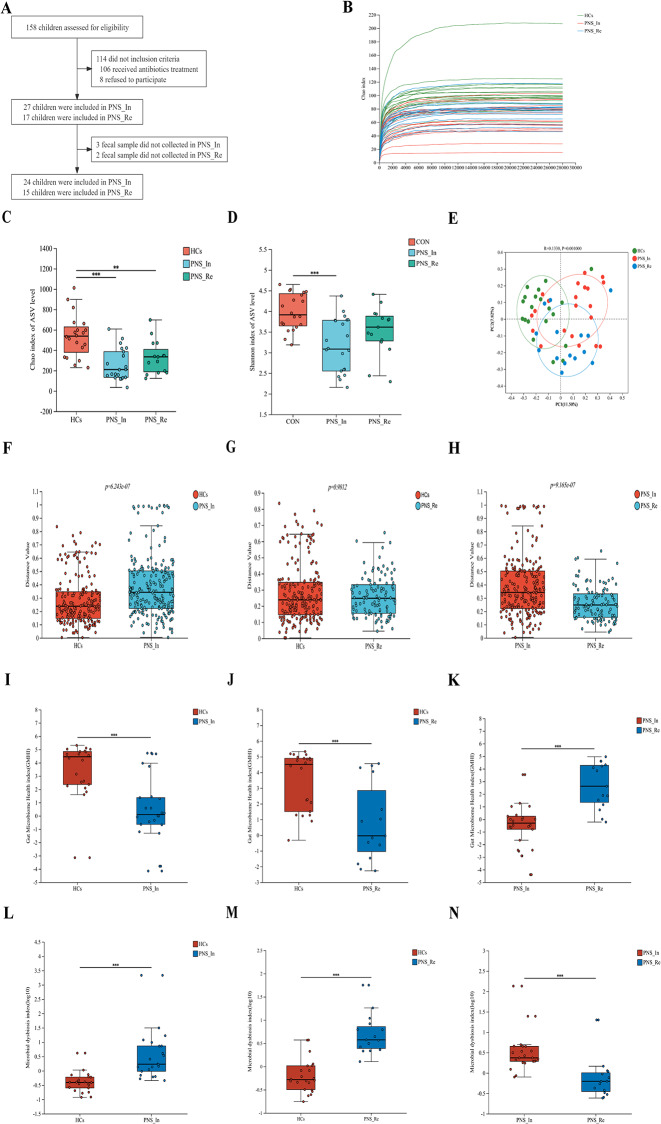
Fig. 1.
Comparison of the intestinal bacterial structure among the HCs, PNS_In and PNS_Re groups. (A) The flow diagram of PNS children enrollment. (B) Rarefaction plot. (C) Alpha diversity Chao index of AVS level. (D) Alpha diversity Shannon index of AVS level. (E) PcoA analysis. (F to H) Analysis of Beta diversity between groups. (I to K) Gut microbiome health index at the species level. (L to N) Microbial dysbiosis index at the species level. Data were expressed as mean ± SD. *P < 0.05, **P < 0.01, ***P < 0.001, ****P < 0.0001

