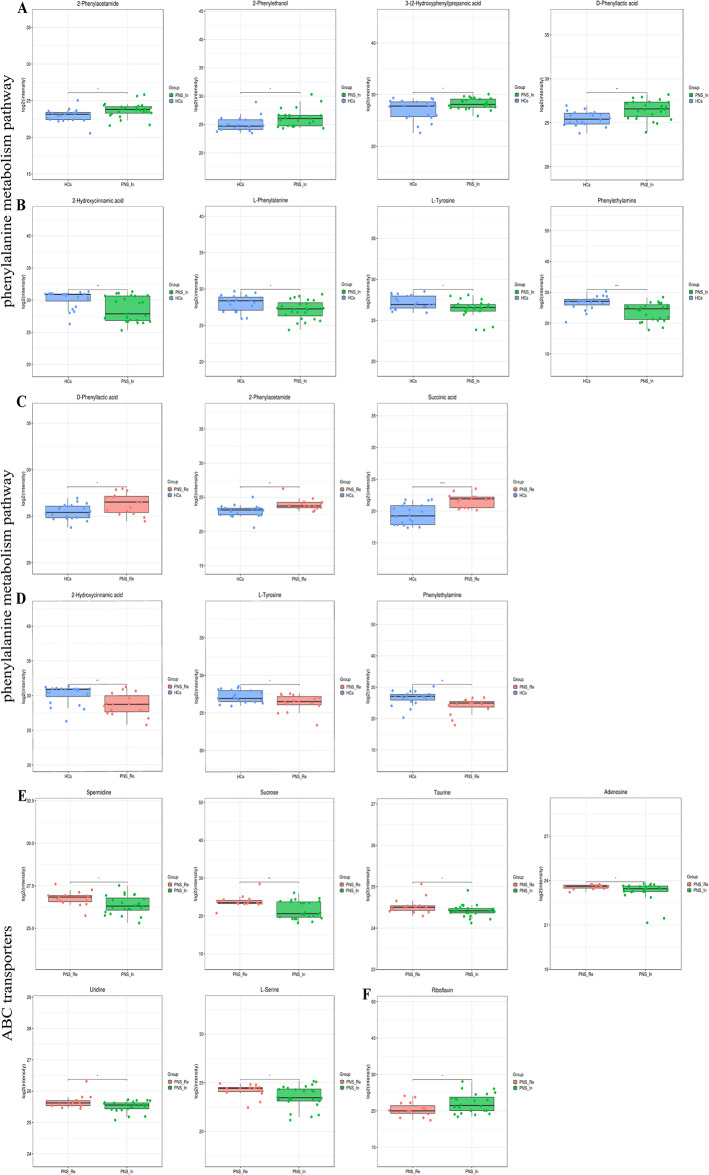
Fig. 10.
The differential metabolites between groups in the phenylalanine metabolism and ABC transporters pathway (red = PNS_Re, green = PNS_In, blue = HCs). (A, B) Boxplot summaries of the peak intensities of the phenylalanine metabolism between PNS_In and HCs. (C, D) Boxplot summaries of the peak intensities of the phenylalanine metabolism between PNS_Re and HCs. (E, F) Boxplot summaries of the peak intensities of the ABC transporters between PNS_Re and PNS_In. Data were expressed as mean ± SD. *P < 0.05, **P < 0.01, ***P <0.0001

