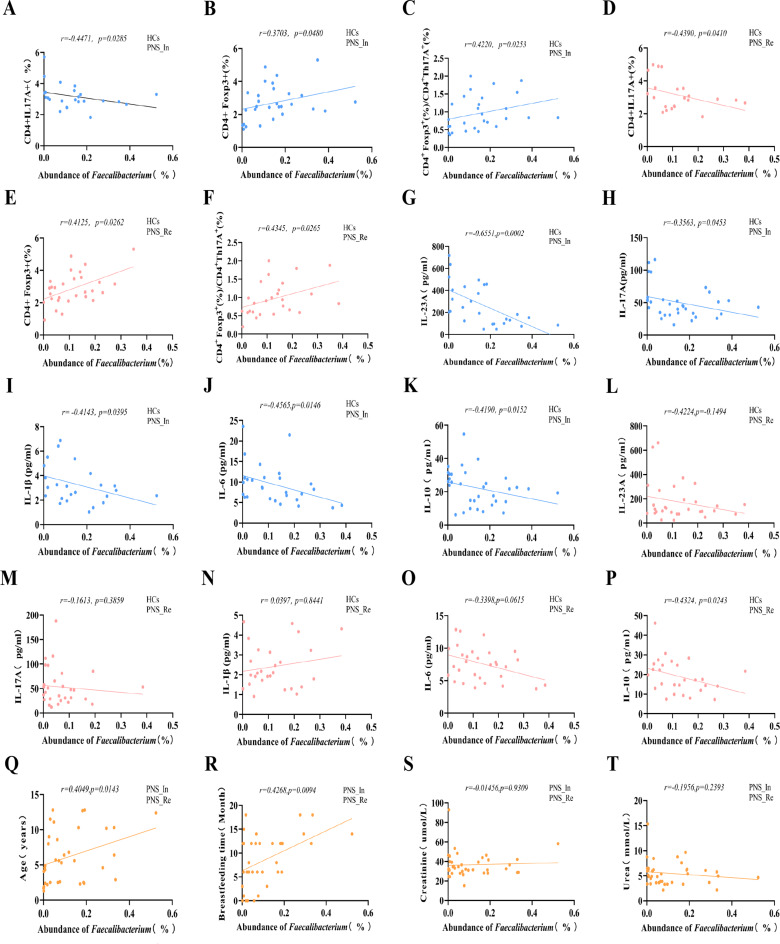
Fig. 4.
Correlation analyses among relative abundance of Faecalibacterium, inflammatory indicators and clinical parameters. (A) To evaluate the relationship between abundance of Faecalibacterium and proportions of Th17 cells, (B) proportion of Treg cells and (C) the ratio of Tregs/Th17 in PNS_In and HCs children, (D) proportions of Th17 cells, (E) proportion of Treg cells and (F) the ratio of Tregs/Th17 in the PNS_Re and HCs children, the concentrations of IL-23 A (G), IL-17 A (H), IL-1β (I), IL-6 (J) and IL-10 (K) in the PNS_In and HCs children, the concentrations of IL-23 A (L), IL-17 A (M), IL-1β (N), IL-6 (O) and IL-10 (P) in the PNS_Re and HCs children, (Q) Age, (R) Breastfeeding time, (S) Creatinine and (T) Urea in PNS group children

