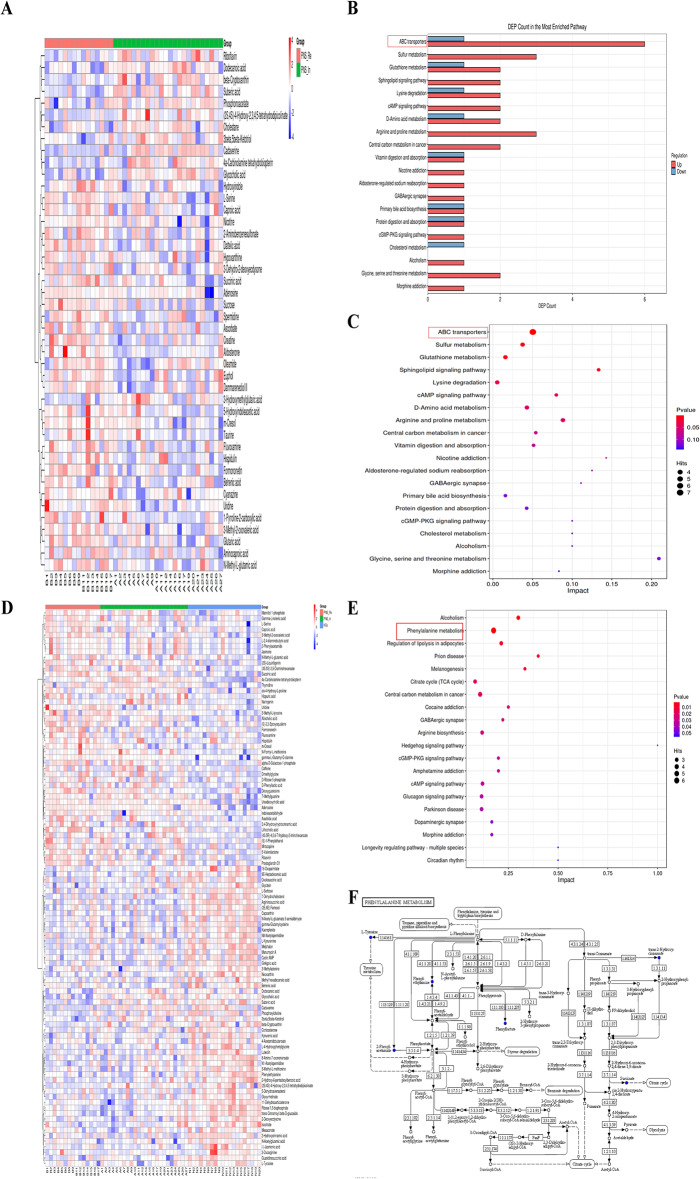
Fig. 9.
The relative abundance of metabolism pathways among three groups. (A) The heatmap of 44 DEMs between PNS_Re and PNS_In groups. (B) The bar chart of the number of specific metabolites change in the pathways between PNS_Re and PNS_In groups. (C) Bubble plots presented the differential metabolism pathways between PNS_Re and PNS_In groups. (D) The heatmap of 100 DEMs among three groups. (E) The bar chart of the number of specific metabolites change in the pathways among three groups. (F) Phenylalanine metabolism-Homo sapiens (human)

