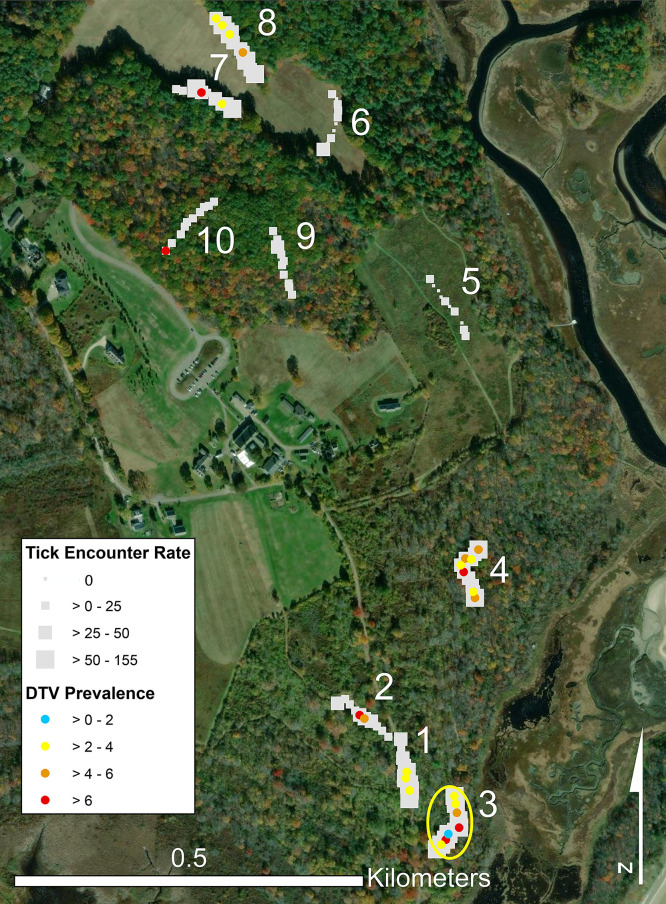
Figure 1.
Map showing the location of transects sampled at the Wells National Estuarine Research Reserve, Wells, ME, April to November, 2018 to 2021. Squares represent the tick encounter rate on each 10-m × 10-m plot within 100-m transects: shrub (transects 1 and 2), forest with invasive vegetation (3 and 4), field (5 and 6), edge (7 and 8), and forest with native vegetation (9 and 10). DTV prevalence rates are indicated by blue, yellow, orange, and red dots. The yellow circle represents a hot spot analysis showing a focus of the elevated entomological risk index. DTV = deer tick virus.

