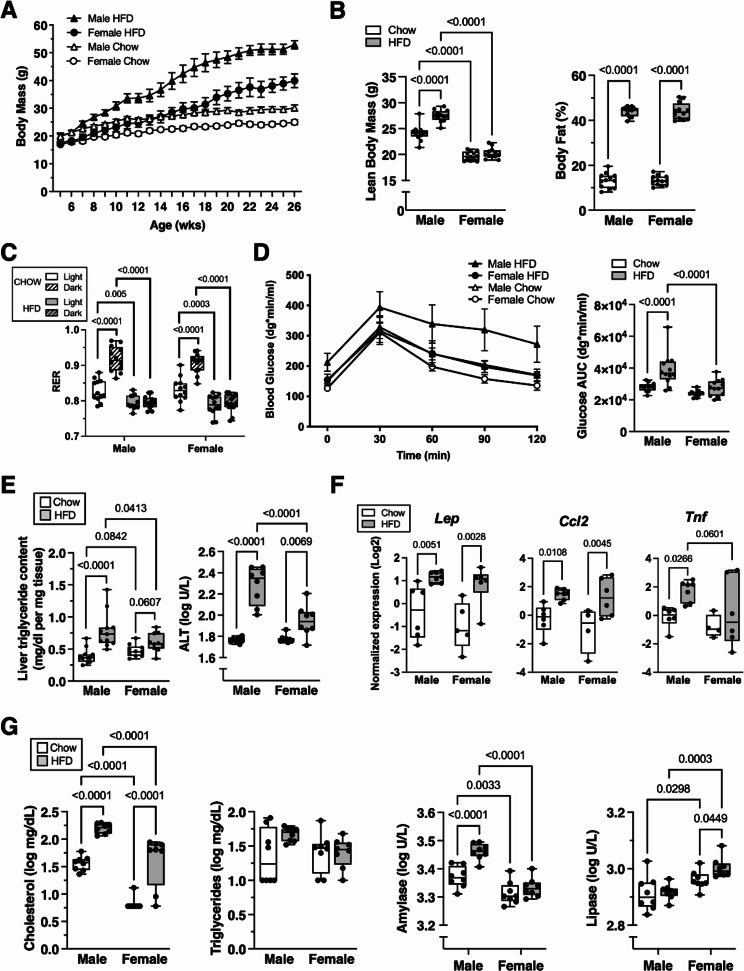
Fig. 1.
Systemic metabolic phenotyping of HFD effects in male and female mice. A Time course of body mass change in male and female mice fed Chow or HFD from 6 to 26 weeks of age. (Three-way RM-ANOVA: Sex [p < 0.0001], Diet [p < 0.0001], Time [p < 0.0001]). B Lean body mass and body fat percentage measured by QMR at 25 weeks of age. (Lean body mass two-way ANOVA: Sex [p < 0.0001], Diet [p < 0.0001], Interaction [p = 0.0001]; Body fat two-way ANOVA: Sex [p = 0.96], Diet [p < 0.0001], Interaction [p = 0.89]). C Respiratory exchange ratio (RER) measured by indirect calorimetry at 25 weeks of age. (Three-way ANOVA: Sex [p = 0.52], Diet [p < 0.0001], Circadian [p < 0.0001], Diet x Circadian [p < 0.0001]). D Blood glucose concentration time course and area under the curve (AUC) obtained from glucose tolerance test measured at 25 weeks of age. (Glucose time course three-way RM-ANOVA: Sex [p = 0.0253], Diet [p = 0.0216], Time [p < 0.0001]; AUC two-way ANOVA: Sex [p < 0.0001], Diet [p = 0.0002], Interaction [p = 0.0434]). E Liver triglyceride content and serum alanine transaminase (ALT), endpoint measurements (Liver triglycerides two-way ANOVA: Sex [p = 0.81], Diet [p < 0.0001], Interaction [p = 0.0091]; ALT two-way ANOVA: Sex [p = 0.0006], Diet [p < 0.0001], Interaction [p = 0.0003]). F Gonadal adipose tissue gene expression, endpoint measurements (Lep two-way ANOVA: Sex [p = 0.21], Diet [p = 0.0002], Interaction [p = 0.71]; Ccl2 two-way ANOVA: Sex [p = 0.33], Diet [p = 0.0004], Interaction [p = 0.56]; Tnf two-way ANOVA: Sex [p = 0.079], Diet [p = 0.028], Interaction [p = 0.46]). G Serum metabolites, endpoint measurements (Cholesterol two-way ANOVA: Sex [p < 0.0001], Diet [p < 0.0001], Interaction [p = 0.41]; Triglycerides two-way ANOVA: Sex [p = 0.28], Diet [p = 0.11], Interaction [p = 0.10]; Amylase two-way ANOVA: Sex [p < 0.0001], Diet [p = 0.0001], Interaction [p = 0.0086]; Lipase two-way ANOVA: Sex [p < 0.0001], Diet [p = 0.11], Interaction [p = 0.20]). Values are mean ± 95%CI. For boxplots, boxes represent the 25th to 75th percentiles, horizontal line indicates the median, and whiskers demonstrate maximum and minimum values. Fisher’s LSD post-hoc paired comparisons shown for p < 0.10. Sample sizes for each analysis provided in Supplemental Table S3

