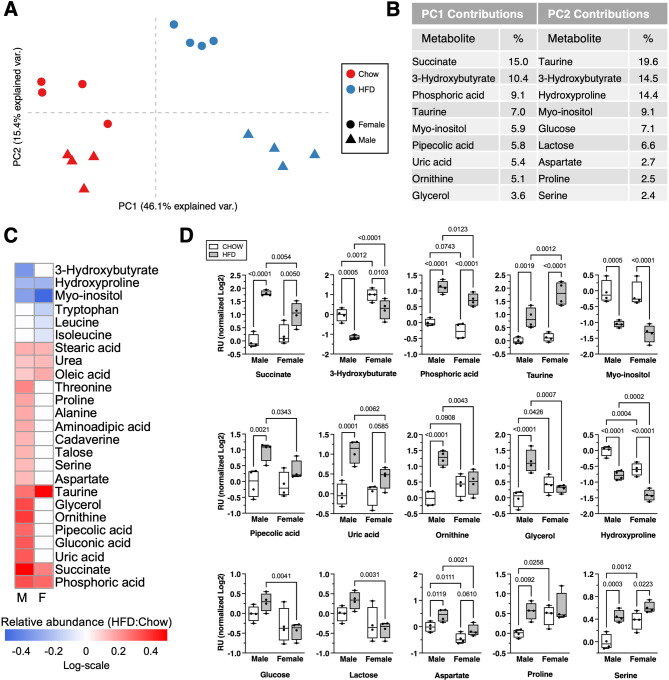
Fig. 2.
Effect of HFD on serum metabolites in male and female mice. A Principal component analysis based on relative abundance values of 49 serum metabolites measured by GC-MS. Symbols represent individual samples (n = 4 per group) according to diet treatment (Chow = red, HFD = blue) and biological sex (female = circle, male = triangle). Principal component 1 (PC1) primarily differentiates between diet treatments, while PC2 primarily differentiates between sexes. B Descending list of the top nine metabolites with the greatest partial contributions to the percentage of variance contributed to PC1 and PC2. C Heatmap of metabolites significantly altered by HFD, expressed as log-scale relative abundance. Diet effects were initially screened by two-way ANOVA, and metabolites showing significance (p < 0.05) were subsequently evaluated by t-test in a sex-specific manner. Significant effects of HFD (p < 0.05) are indicated by the presence of a heatmap color, whereas white indicates p ≥ 0.05. D Serum metabolite values for metabolites shown in panel B, expressed as relative units normalized to male Chow average and log2 transformed. Boxplots represent the 25th to 75th percentiles, horizontal line indicates the median, and whiskers demonstrate maximum and minimum values. Fisher’s LSD post-hoc paired comparisons shown for p < 0.10. Two-way ANOVA values: Succinate (Sex [p = 0.125], Diet [p < 0.0001], Interaction [p = 0.0086]); 3-Hydroxybutyrate (Sex [p < 0.0001], Diet [p = 0.0001], Interaction [p = 0.24]); Phosphoric acid (Sex [p = 0.0047], Diet [p < 0.0001], Interaction [p = 0.50]); Taurine (Sex [p = 0.0053], Diet [p < 0.0001], Interaction [p = 0.024]); Myo-inositol (Sex [p = 0.24], Diet [p < 0.0001], Interaction [p = 0.48]); Pipecolic acid (Sex [p = 0.087], Diet [p = 0.0018], Interaction [p = 0.16]); Uric acid (Sex [p = 0.0417], Diet [p = 0.0002], Interaction [p = 0.0332]); Ornithine (Sex [p = 0.26], Diet [p = 0.0009], Interaction [p = 0.0026]); Glycerol (Sex [p = 0.14], Diet [p = 0.0021], Interaction [p = 0.0004]); Hydroxyproline (Sex [p < 0.0001], Diet [p < 0.0001], Interaction [p = 0.83]); Glucose (Sex [p = 0.0041], Diet [p = 0.58], Interaction [p = 0.17]); Lactose (Sex [p = 0.004], Diet [p = 0.46], Interaction [p = 0.12]); Aspartate (Sex [p = 0.0004], Diet [p = 0.004], Interaction [p = 0.54]); Proline (Sex [p = 0.06], Diet [p = 0.0143], Interaction [p = 0.15]); Serine (Sex [p = 0.0012], Diet [p = 0.0002], Interaction [p = 0.11])

