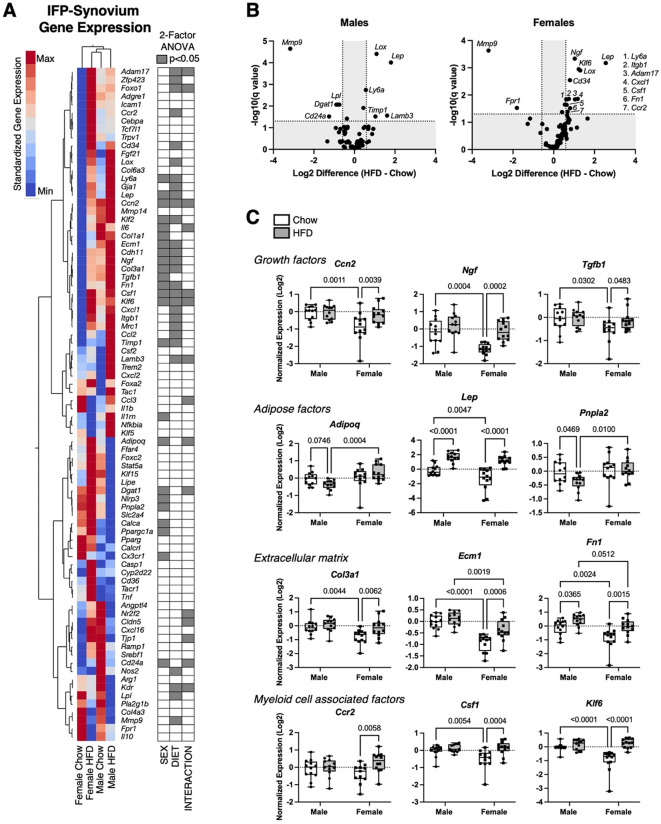
Fig. 4.
Effect of HFD on IFP-synovium gene expression in male and female mice. A 2-way hierarchical clustering analysis of IFP-synovium gene expression values versus experimental groups. Heatmap color legend signifies standardized expression values calculated by subtracting the mean and dividing by the standard deviation. Two-factor ANOVA chart indicates significant factor effects for genes in corresponding rows. B Sex-specific effects of HFD on gene expression evaluated by log2 transformed volcano plot comparisons. Labelled genes have false discovery rate adjusted (Q = 5%) significance (q < 0.05) and minimum log 2-transformed differential expression value ±0.585 (1.5-fold change). C Expression data for selected genes presented as log 2-transformed fold-change normalized to male Chow diet samples using the delta-delta Ct method. Boxplots represent the 25th to 75th percentiles, horizontal line indicates the median, and whiskers demonstrate maximum and minimum values. Fisher’s LSD post-hoc paired comparisons shown for p < 0.10. Two-way ANOVA values: Ccn2 (Sex [p = 0.0064], Diet [p = 0.032], Interaction [p = 0.042]); Ngf (Sex [p = 0.0006], Diet [p = 0.0002], Interaction [p = 0.087]); Tgfb1 (Sex [p = 0.048], Diet [p = 0.089], Interaction [p = 0.26]); Adipoq (Sex [p = 0.0047], Diet [p = 0.89], Interaction [p = 0.018]); Lep (Sex [p = 0.0059], Diet [p < 0.0001], Interaction [p = 0.20]); Pnpla2 (Sex [p = 0.025], Diet [p = 0.17], Interaction [p = 0.14]); Col3a1 (Sex [p = 0.0087], Diet [p = 0.014], Interaction [p = 0.14]); Ecm1 (Sex [p < 0.0001], Diet [p = 0.0021], Interaction [p = 0.057]); Fn1 (Sex [p = 0.0006], Diet [p = 0.0003], Interaction [p = 0.39]); Ccr2 (Sex [p = 0.94], Diet [p = 0.022], Interaction [p = 0.082]); Csf1 (Sex [p = 0.047], Diet [p = 0.0015], Interaction [p = 0.042]); Klf6 (Sex [p = 0.0042], Diet [p < 0.0001], Interaction [p = 0.0007]). Sample sizes for each analysis provided in Supplemental Table S3

