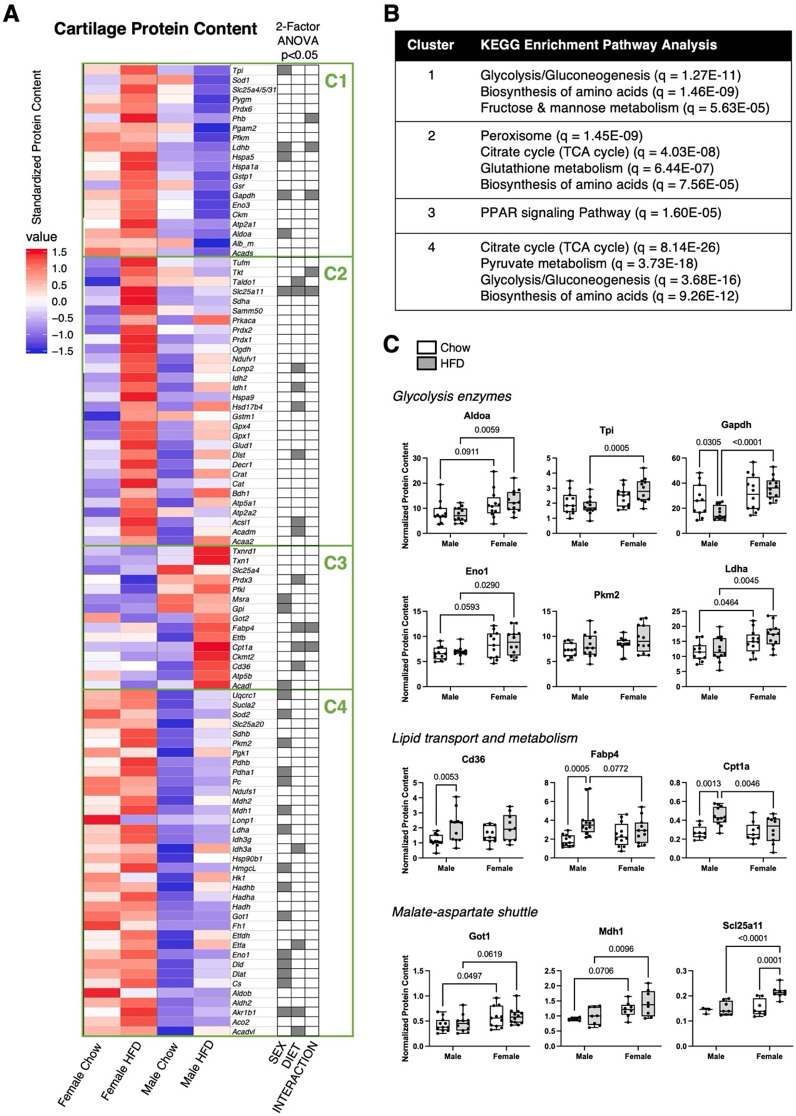
Fig. 7.
Effect of HFD on cartilage protein content in male and female mice. Protein abundance was measured by selected reaction monitoring (SRM) mass spectrometry in cartilage harvested from knees of male and female mice fed Chow or HFD from 6 to 26 weeks of age. A Heat map of log-transformed protein abundance values normalized to the median, across both diet conditions and sexes. Proteins were grouped in clusters based on Euclidian distance dissimilarity matrix and partitioning around mediods algorithm. Cluster numbers (C1-C4) determined by silhouette algorithm. Two-factor ANOVA chart indicates significant factor effects for proteins in corresponding rows. B Top significant predicted pathways (qFDR < 0.05) associated with proteins in each cluster based on pathway analysis performed using STRING database over KEGG background. C Protein abundance data for selected proteins normalized to sample’s total ion current. Boxplots represent the 25th to 75th percentiles, horizontal line indicates the median, and whiskers demonstrate maximum and minimum values. Fisher’s LSD post-hoc paired comparisons shown for p < 0.10. Two-way ANOVA values: Aldoa (Sex [p = 0.0022], Diet [p = 0.91], Interaction [p = 0.43]); Tpi (Sex [p = 0.0010], Diet [p = 0.70], Interaction [p = 0.095]); Gapdh (Sex [p = 0.0002], Diet [p = 0.38], Interaction [p = 0.026]); Eno1 (Sex [p = 0.0050], Diet [p = 0.47], Interaction [p = 0.84]); Pkm2 (Sex [p = 0.045], Diet [p = 0.092], Interaction [p = 0.82]); Ldha (Sex [p = 0.0009], Diet [p = 0.21], Interaction [p = 0.53]); Cd36 (Sex [p = 0.53], Diet [p = 0.0043], Interaction [p = 0.28]); Fabp4 (Sex [p = 0.64], Diet [p = 0.0021], Interaction [p = 0.042]); Cpt1a (Sex [p = 0.068], Diet [p = 0.0081], Interaction [p = 0.041]); Got1 (Sex [p = 0.0080], Diet [p = 0.67], Interaction [p = 0.92]); Mdh1 (Sex [p = 0.0029], Diet [p = 0.18], Interaction [p = 0.61]); Scl25a11 (Sex [p = 0.0031], Diet [p = 0.0054], Interaction [p = 0.026]). Sample sizes for each analysis provided in Supplemental Table S3

