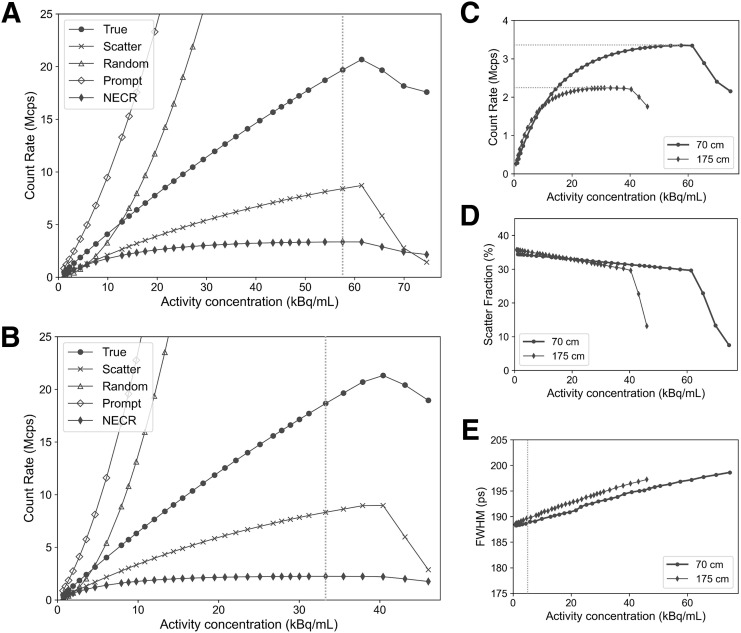
FIGURE 2.
(A) Results for true, scatter, random, prompt, and NECR as functions of activity concentration for NEMA standard 70-cm scatter phantom. Dashed line corresponds to NECR peak. (B) Results for true, scatter, random, prompt, and NECR as function of activity concentration for 175-cm scatter phantom. Dashed line corresponds to NECR peak. (C) NECR as function of activity concentration for both 70-cm-long and 175-cm-long scatter phantoms. Dashed lines correspond to NECR peaks for both phantoms. (D) Scatter fraction as function of activity concentration for both 70-cm-long and 175-cm-long scatter phantoms. Scatter fractions at 5.3 kBq/mL for 70-cm-long and 175-cm-long phantoms are 34.13% and 35.09%, respectively, and scatter fractions at peak NECR are 29.94% and 30.85%. (E) TOF resolution as functions of activity concentration for both 70-cm-long and 175-cm-long scatter phantoms. Dashed line corresponds to 5.3 kBq/mL. TOF at 5.3 kBq/mL is 188.8 and 189.7 ps for 70-cm-long and 175-cm-long phantoms, respectively, and TOF at peak NECR is 196.8 and 195.2 ps. FWHM = full width at half maximum.

