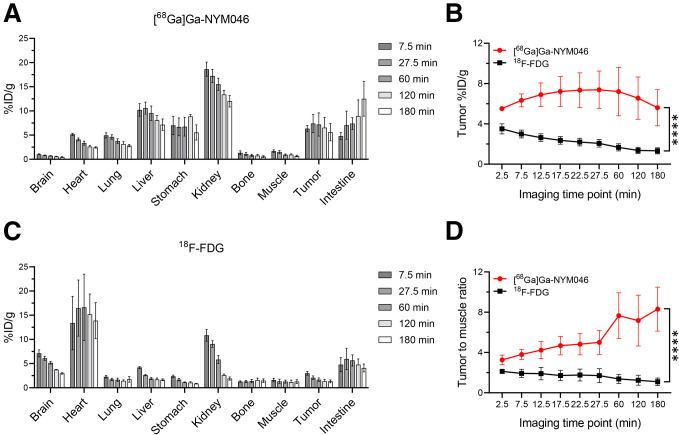
FIGURE 3.
(A and C) Radioactivity biodistribution of [68Ga]Ga-NYM046 (A) and 18F-FDG (C) in various organs in OS-RC-2 tumor model at different time points after injection. (B and D) Quantitative curves of tumor uptake (B) and contrast (D) with background tissues (tumor-to-muscle contrast). ****P < 0.0001.

