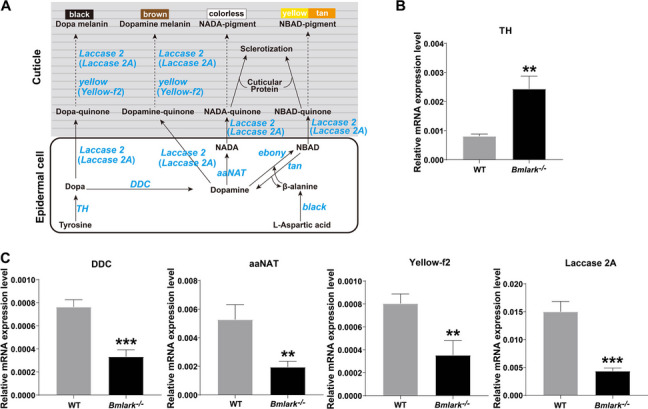
Fig. 5.

The tyrosine-mediated pigment synthesis pathway and expression analysis of key genes. A Schematic diagram of the tyrosine-mediated pigment synthesis pathway [39, 40]. Dashed lines indicate multistep biochemical reactions. The key genes that encode the enzymes involved in the tyrosine-mediated pigment synthesis pathway are shown in blue. (B and C) RT-qPCR analysis of the expression of the key genes in the Bmlark−/− mutant and WT embryos at the head pigmentation stage. Student’s t-test was used to evaluate statistical significance. Results are presented as the mean ± SE of three biological replicates. **p ≤ 0.01; ***p ≤ 0.001
