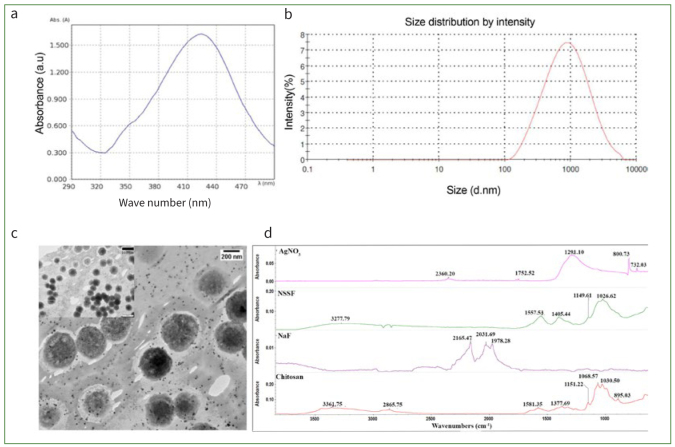
Fig 2.
Characterisation of synthesised NSSF by (a) UV-vis spectroscopy with a peak observed at 420 nm; (b) size distribution analysis by Zeta-sizer; (c) TEM of NSSF showing Ag NP and larger fluoride clusters (image scaled at 200 nm) along with a smaller inset image at 500 nm; (d) FTIR spectral data of neat CH, NaF, silver nitrate and prepared NSSF after drying a pellet of the solution on a clean glass slide.

