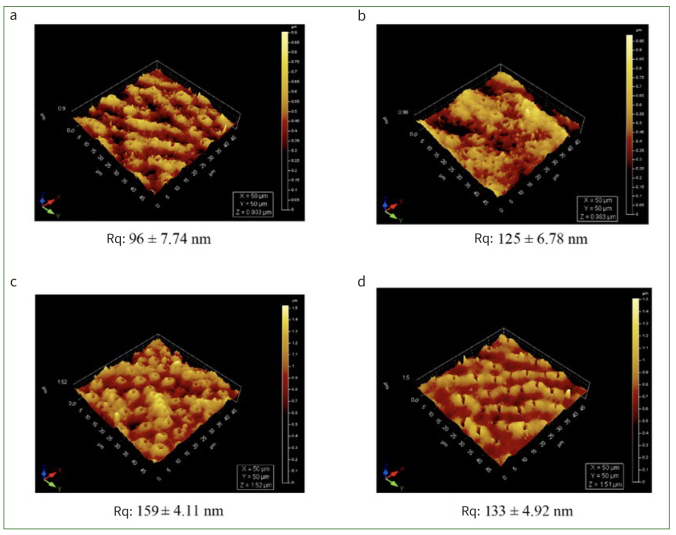
Fig 3.
AFM 3D images showing the structural and topographical variations of surface (a) control, (b) NSSF, (c) NaF and (d) SDF showing a 50 x 50 µm area of interest, depicting different morphological observations of dentinal tubules, peritubular and intertubular dentin. Tubular lumen show a different morphology (a) when compared with treated specimens. Rq: the root mean square (RMS) roughness.

