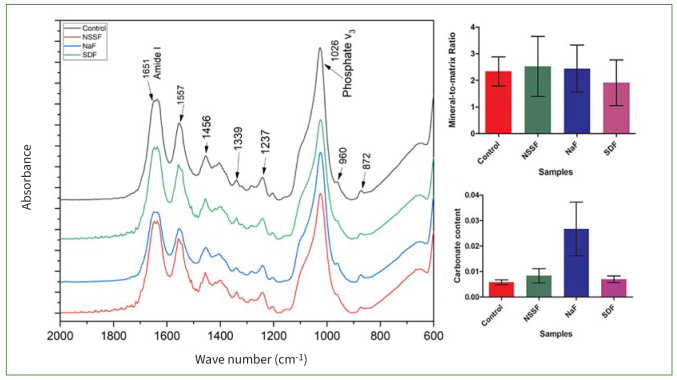
Fig 4.
FTIR spectral data of control, NSSF, NaF and SDF. Image shows average statistical spectra depicting the alterations in the phosphate band at 1026 and 872 cm1 and amide-I vibration at 1651 cm1. Mineral to matrix ratio (M:M) and carbonate content calculated using the peak area tool for control, NSSF, NaF and SDF.

