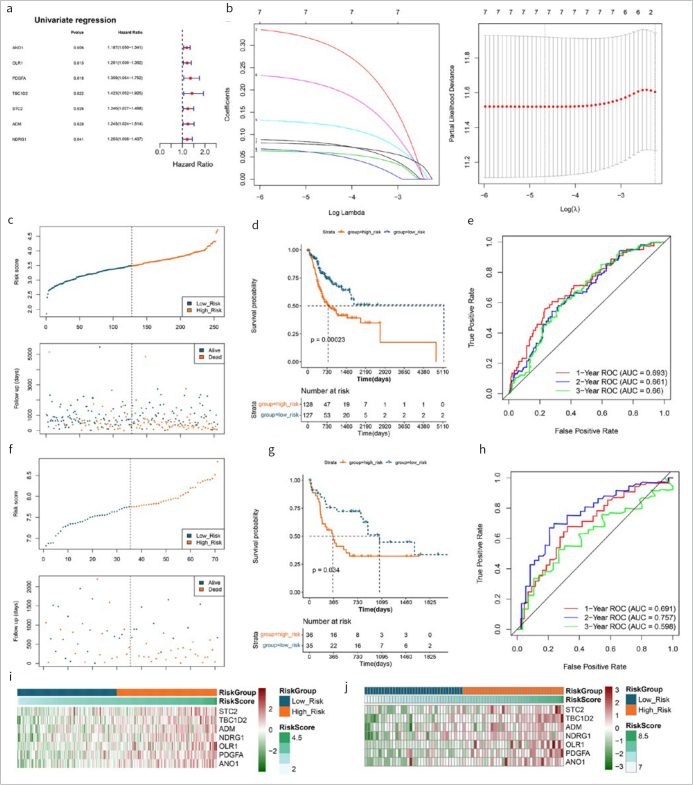
Fig 2.
>Prognostic-related DERs screening and prognostic signature of DERs construction. (a): Univariate regression forest maps of 7 prognosis-related differentially expressed resistant genes (DERs). (b): LASSO filter parameter diagram. (c) and (f): RS distribution and survival time state in TCGA and GSE42743. (d) and (g): KM curves related to 8 optimized gene prognostic models in TCGA and GSE42743. Blue and red curves represent low risk and high risk sample groups respectively. (e) and (h): ROC curve curves of 7 optimal gene prognostic models in TCGA and GSE42743. (i) and (j): Expression heat maps of model genes in training set TCGA OSCC (i) and validation set GSE42743 (j).

