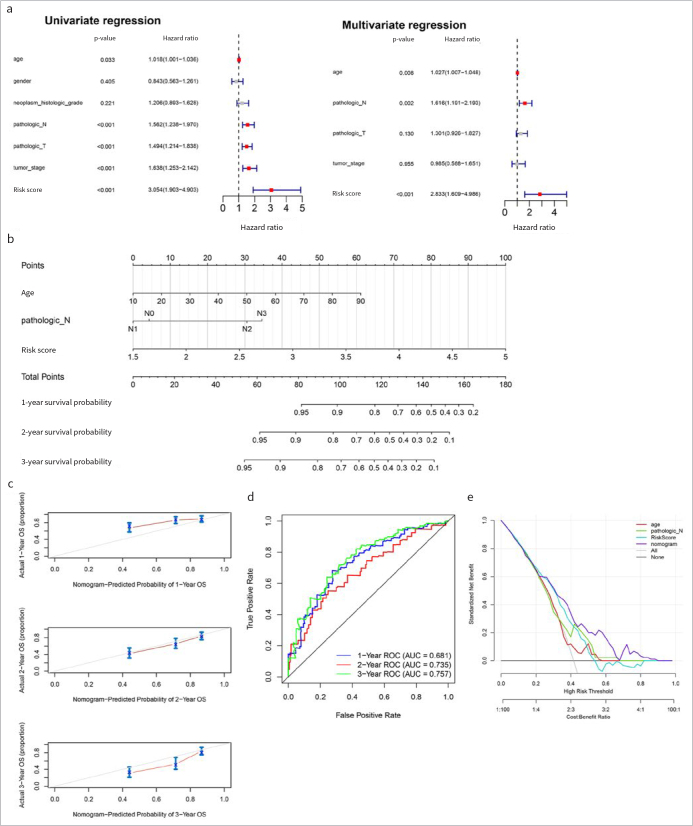
Fig 4.
Independent analysis of prognostic model and normgram establishment. (a): Forest maps of clinical factors in univariate and multivariate Cox regression analyses. (b): Independent prognostic factors nomogram of survival prediction model. (c): Calibration curve of 1-, 2-, and 3-year survival predictions with actual survival. (d): The 1-, 2-, 3-years ROC curves of nomogram. (e): Decision curves for gender, pathologic N, stage and RS model.

