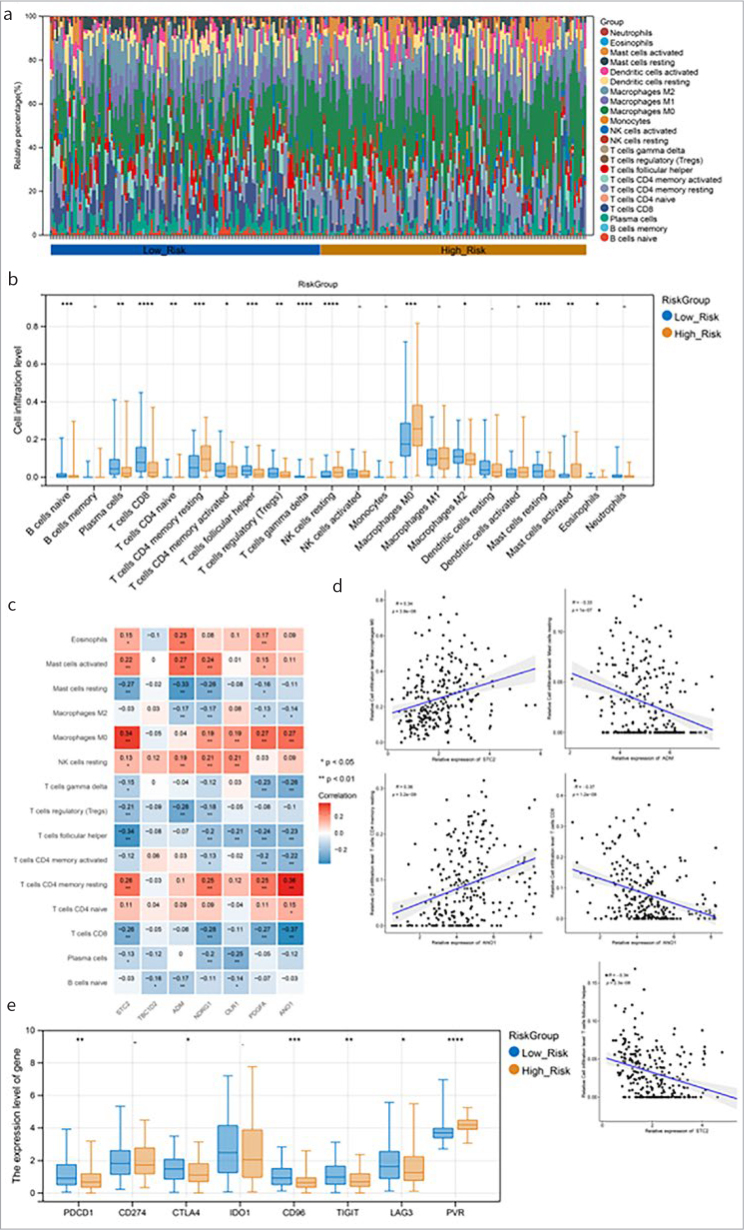
Fig 6.
Associations between risk groupings and immune microenvironments. (a): The relative proportions of 22 types of immune cells. (b): Horizontal box-and-whisker plot of immune cell infiltration levels in high- and low-risk groups. (c): Heat maps of correlations between model genes and 15 different immune cells (numbers are correlation coefficients; *p<0.05, **p<0.01, ***p<0.001, **** p<0.0001). (d): The gene-cell correlation scatter plot of correlation coefficient >0.3 and p<0.05. (e): Box-and-whisker plot of immune checkpoint gene expression between high- and low-risk groups.

