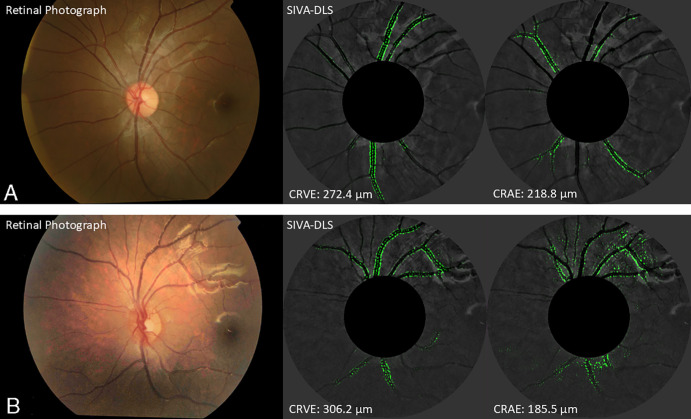
Figure.
Retinal photographs on the left, and SIVA-DLS heatmaps with venular and arteriolar boundaries highlighted to predict CRAE and CRVE on the right, of children more physically active (a) and less physically active (b). The estimations of CRAE and CRVE computed by SIVA-DLS on retinal photographs of two children, one with higher ratio and the other with lower ratio. The heatmaps generated by SIVA-DLS highlighted the boundaries for arterioles and venules used to predict CRAE and CRVE, respectively.

