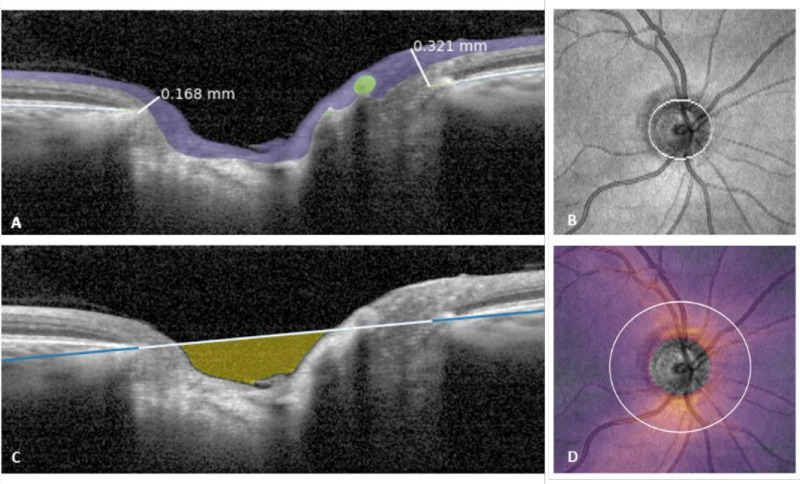
Figure 2.
Visualization of extracted biomarkers. (A) Minimum rim width, defined as the minimum distance between the BM edge and ILM (white lines). (B) Surface of the BMO. (C) Cup volume, defined as the space between the RNFL/prelaminar tissue and the line that cuts the BM edges (in this instance only visualized in a single B-scan). (D) cpRNFL thickness, computable at any diameter from the center of the ONH from cubic acquisition OCT volumes.

