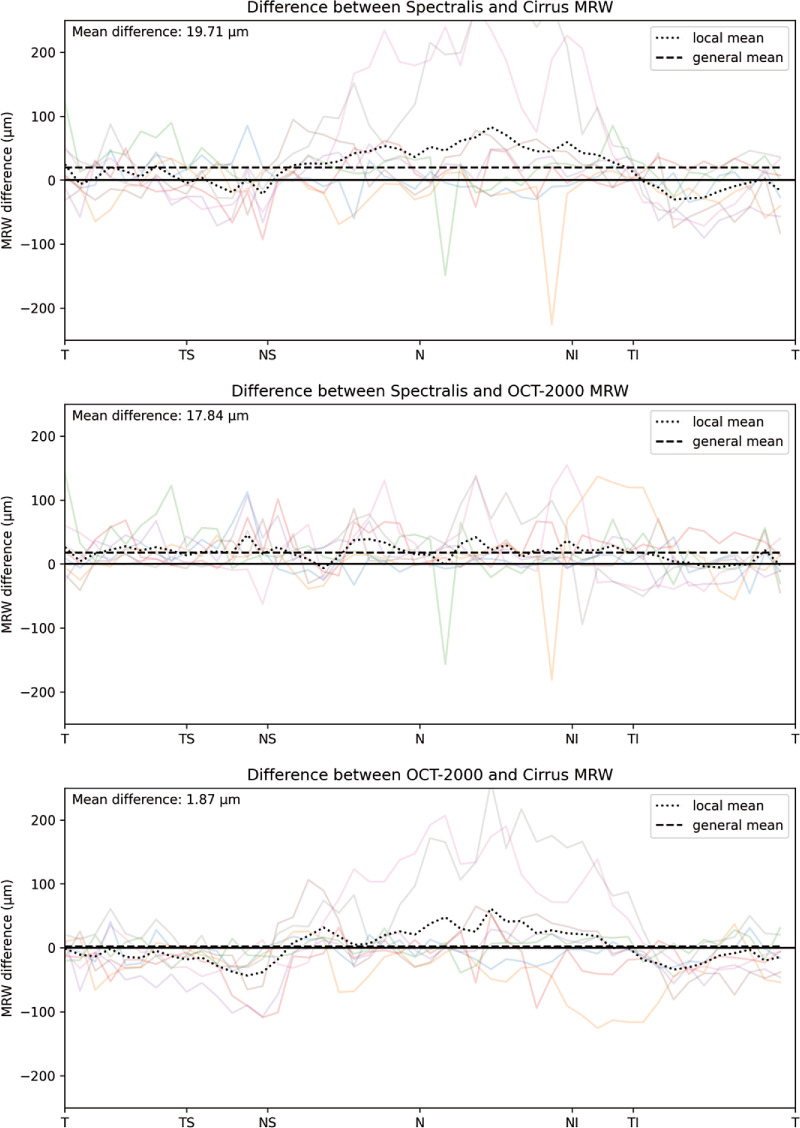
Figure 7.
Visualization of the MRW mean differences for the model output among the different devices. The individual differences for all eight eyes are plotted in the background, with the mean of those differences across the circular scan shown as a dashed black line, the general mean as a dotted line, and the zero difference as a solid black line.

