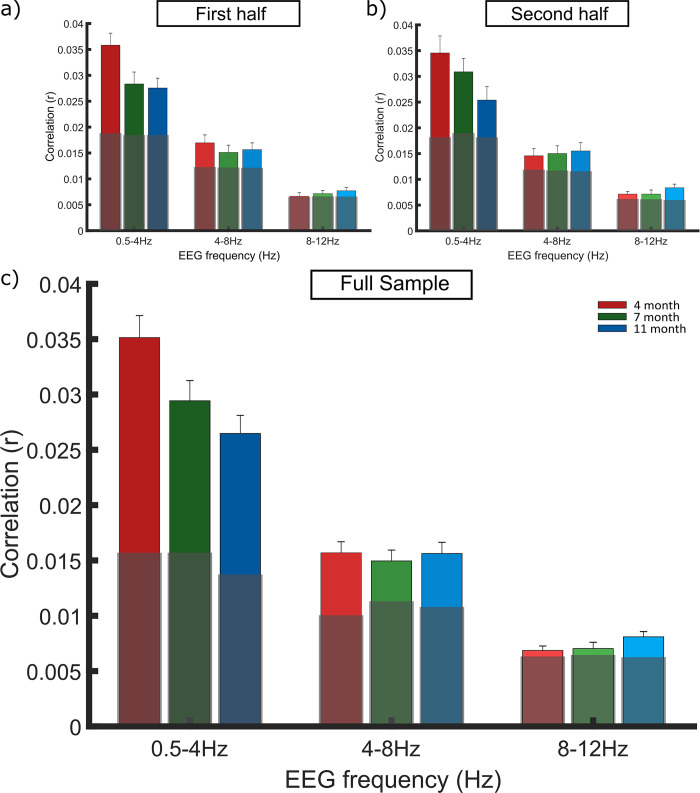
Fig 1. mTRF replication.
Grand averaged stimulus reconstruction values (Pearson’s r) per frequency band in the a) first half, b) second half and c) full infant cohort. Each bar represents the grand average r value across the participants at the 3 age points: 4-months (red), 7-months (green) and 11-months (blue). Age responses are grouped along the X axis by EEG frequency band, delta (0.5–4 Hz) theta (4–8 Hz) and alpha (8–12 Hz). Light grey boxes signify the average chance r value across subjects, calculated separately for each band. Outlier analysis was conducted to remove extreme values which would compromise the LMEMs. Panel a is reproduced from Attaheri et al. (2022) [1], with permission.

