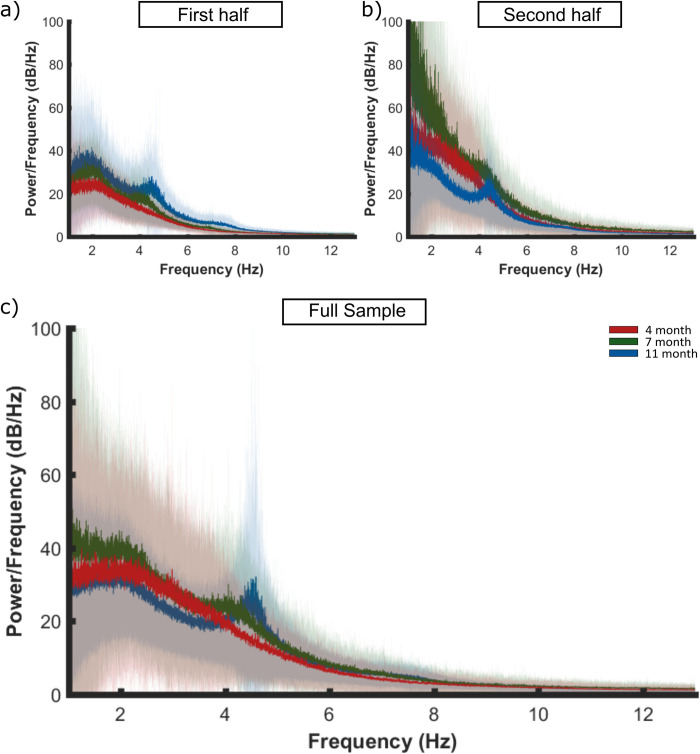
Fig 2.
Spectral decomposition of the EEG signal averaged across the a) first half, b) second half and c) full infant cohort (1–12 Hz plotted, from 0.5 to 45 Hz calculated), in response to nursery rhyme stimulation. A periodogram was used to obtain a power spectral density (PSD) estimate separately for 4- (red), 7- (green) and 11- (blue) months data. First the PSD estimate was averaged across channels per participant. Bold lines indicate the grand average mean values and pale shading plots the standard deviation of the data across the participants. Outlier analysis was also conducted to remove extreme data points that would compromise the LMEM. Panel A is reproduced from Attaheri et al. 2022 [1], with permission.

