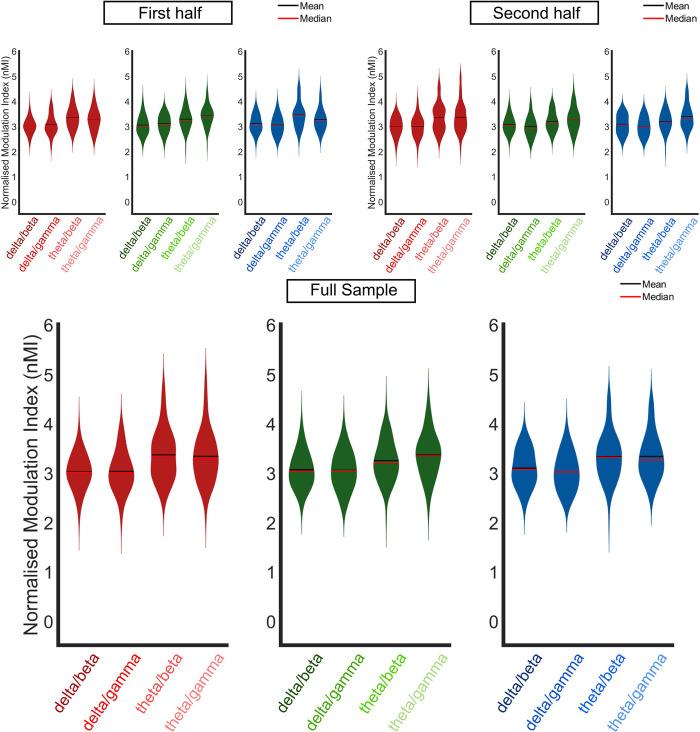
Fig 3. PAC replication.
Violin plots of phase amplitude coupling (normalised modulation index, nMI) at 4-months (red), 7-months (green) and 11-months (blue) for the a) first half, b) second half and c) full infant cohort. The nMIs, from all significant analysis windows, were averaged for each individual infant. The PAC pairing with the maximum nMI per infant, from within the pre-defined frequency bands of interest (delta/beta, delta/gamma, theta/beta and theta/gamma; delta 2–4 Hz, theta 4–8 Hz, beta 15–30 Hz and gamma 30–45 Hz), were included in the grand average violin plot. Horizontal black and red lines represent the group mean and median respectively. Outlier analysis was conducted to remove extreme data points that would compromise the LMEM. Panel A is reproduced from Attaheri et al. 2022 (1), with permission.

