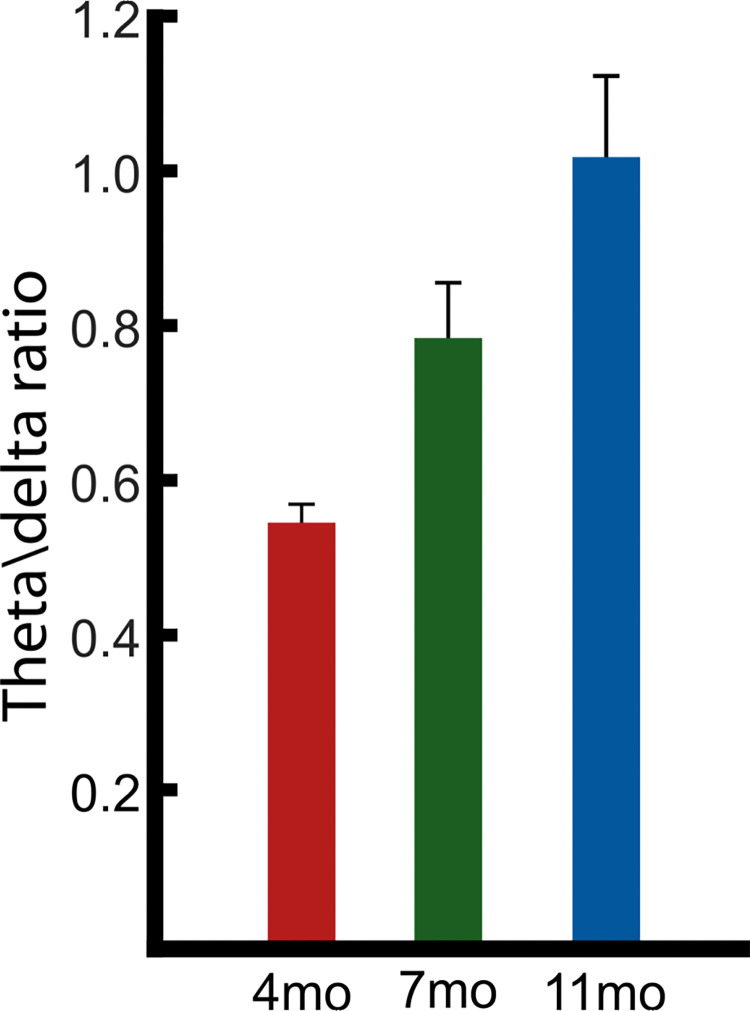
Fig 4. Theta/Delta PSD ratio.
The PSD peak per individual at 4.35 Hz and 1.92 Hz, taken from the spectral decomposition of the EEG signal, was used to create a theta / delta ratio calculation (4.35/1.92). Data provided at 4-months (red), 7-months (green) and 11-months (blue) with standard error bars in black.

