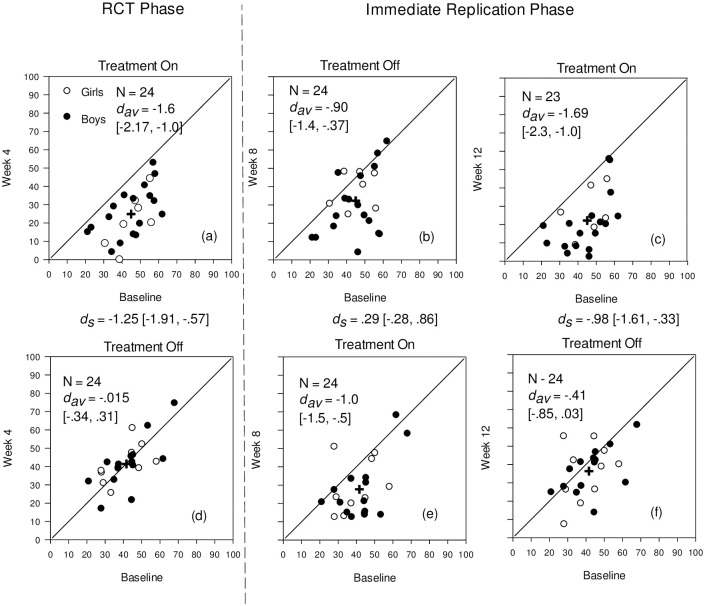
Fig 2. Changes for the ITG and IWLG on the CL-ARI from baseline to week 4, 8, and 12.
Note. Modified Brinley Plots showing individual scores and average change (as shown with the cross) at baseline and at week 4, 8, and 12 for the Revised Clinician-Rated Temper and Irritability Scale (CL-ARI). The solid diagonal line indicates no change. The between- (ds) and within-group (dav) effect sizes are shown at each time point. The 95% Confidence Interval is shown in [] .

