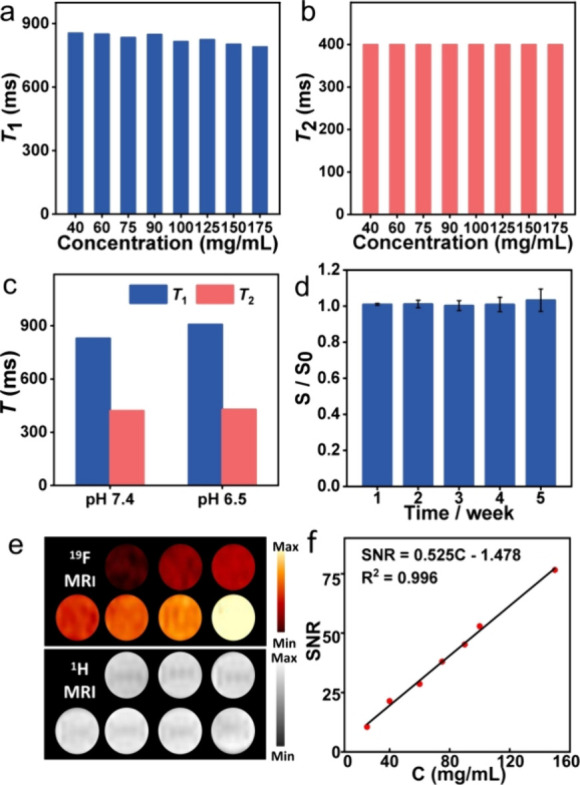
Figure 2.

(a) T1 and (b) T2 values of PIBMA-FSON with different concentrations. (c) Comparison of T1 and T2 of PIBMA-FSON at different pH conditions. (d) Evolution of the 19F NMR SNR of PIBMA-FSON along with time. S and S0 refer to the 19F SNR of the probe (PBS buffer) at the day of the test and the initial state, respectively. (e) 19F (top) and 1H (bottom) MR images of PIBMA-FSON with various concentrations. (f) Linear plot of 19F MRI SNR versus PIBMA-FSON concentration.
