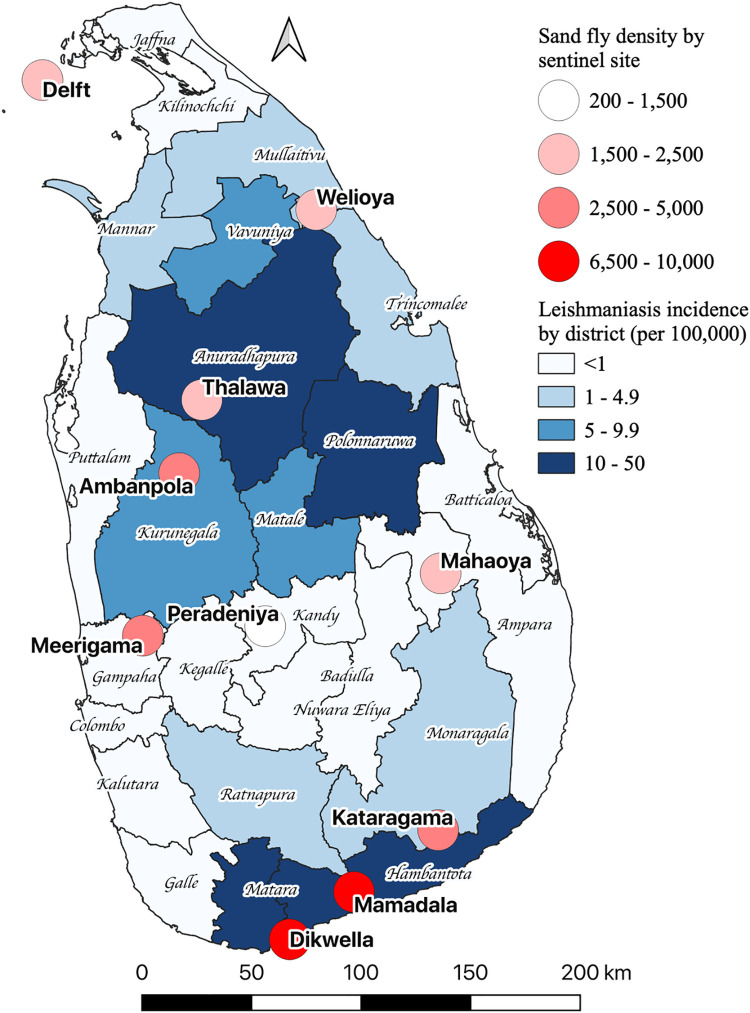
Fig 1. Sand fly density by sentinel site and annual average leishmaniasis incidence (per 100,000 population) by district from 2018 to 2020 in Sri Lanka.
The blue shaded areas indicate the leishmaniasis incidence and the red shaded circles show the geographical locations and the cumulative number of sand flies collected at each sentinel site for the study period. The base map shapefile was obtained from the Humanitarian Data Exchange. The data is licensed under Creative Commons Attribution International Governmental Organization (CC BY-IGO). No changes were made to the original file. Link to the base layer of the map https://data.humdata.org/dataset/sri-lanka-administrative-levels-0-4-boundaries.

