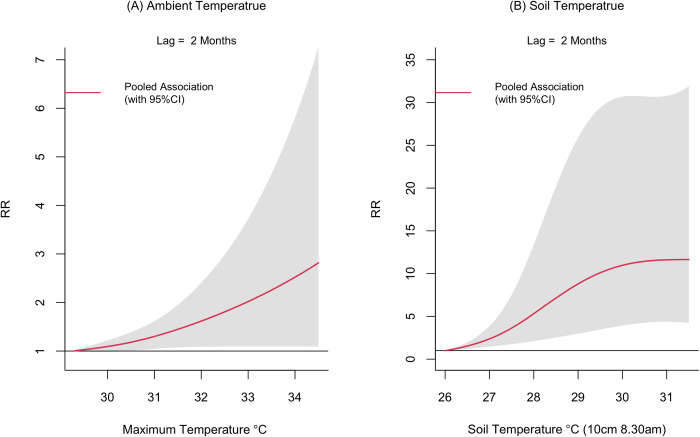
Fig 3.
Relative risk (RR) of leishmaniasis vector density (measured by UV LED CDC traps) by ambient temperature (maximum) (panel A) and soil temperature measured at 8.30 am at 10cm below the surface and evaporation (panel B) at the lag of 2 months. The exposure-response functions at each lag were predicted from the pooled exposure-response function obtained from the meta-analysis for all surveillance sites in Sri Lanka, 2018–20. Shaded areas are 95% CIs. Relative risks were calculated with reference to the risk at a soil temperature of 26°C and maximum temperature of 29.3°C. The full spectrum of the associations is given in Figs G and K in S1 Text.

