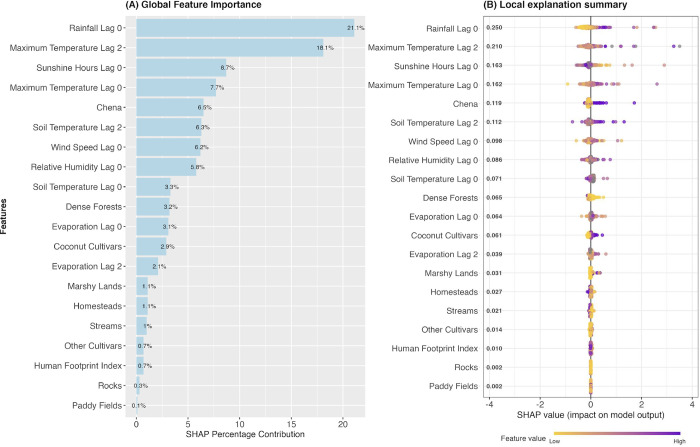
Fig 4. SHAP feature importance plot for sand fly densities measured by light traps.
The panel A (Global Feature of Importance) bar chart presents the percentage contribution of mean SHAP values estimated for each feature. The panel B (Local Explanation Summary) is a set of beeswarm plots showing feature impact on the model output in their full range of values. The purple color indicates a higher value of corresponding variables and the yellow color indicates a lower value. The dot’s position on the x-axis shows the impact that feature on the model’s prediction of sand fly densities. Plots of SHAP values for each variable with better visual effect is given in the Figs O and P in S1 Text.

