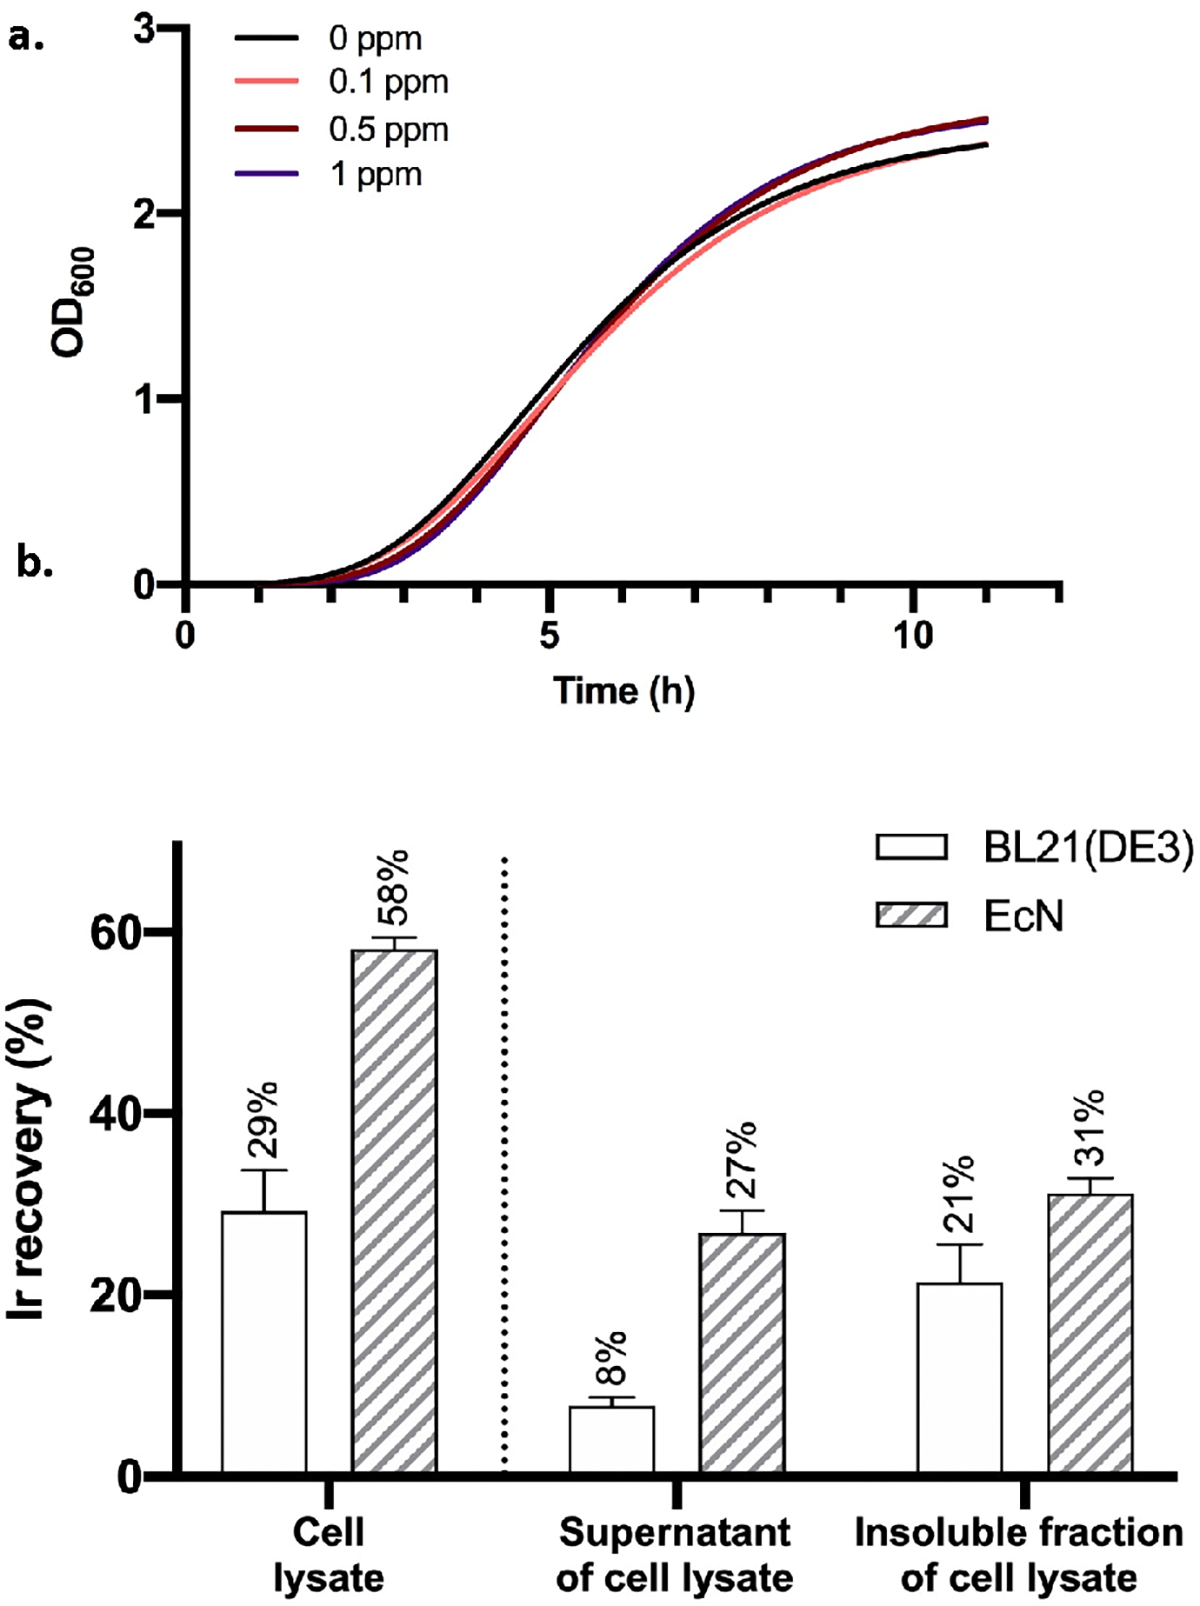
Figure 2.

(a) The cell growth curves of EcN in the presence of 0, 0.1, 0.5, and 1 ppm of Ir(Me)MPIX. 1 ppm = 1 mg/L. The curves were fitted to a Gompertz growth model using Prism 8.29 (b) The percentages of iridium added to the growth medium that were recovered in the total cell lysates and the percent within the supernatants of cell lysates and the insoluble fractions of cell lysates from the two E. coli strains expressing CYP119. The data are shown as the average from three biological replicates, with error bars indicating 1 standard deviation.
