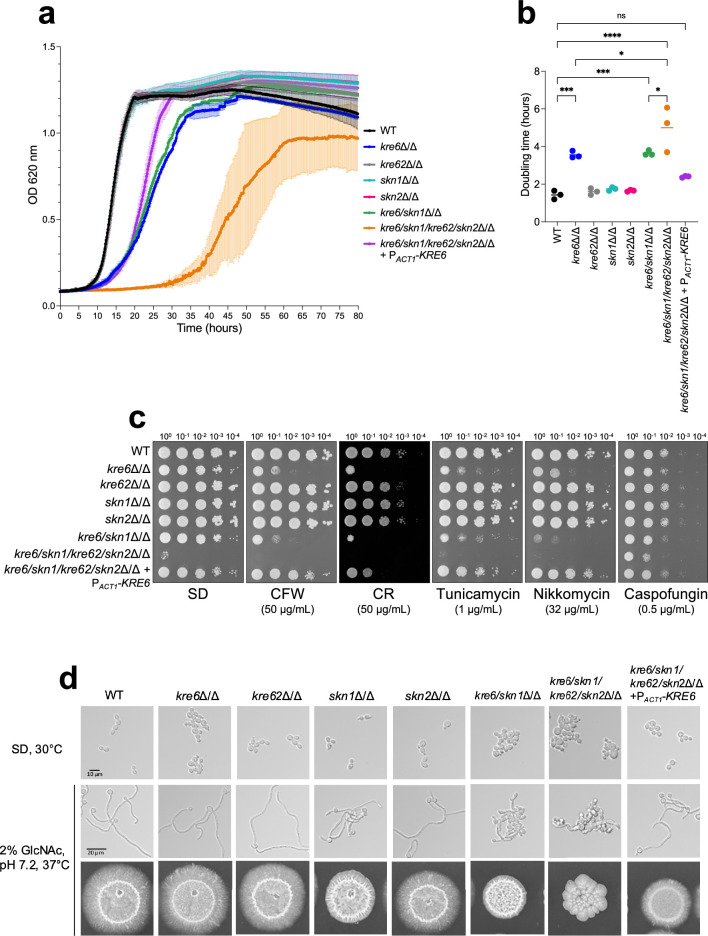
Figure 4. Phenotypic characterization of KRE6 family mutants: growth kinetics, drug susceptibility, and filamentation.
(a) Kinetic curve of all strains grown in liquid synthetic dextrose (SD) medium, 30°C. Optical density at 620 nm was measured every 10 min during 80 hr by TECAN SUNRISE. Means and standard deviations were calculated from three independent experiments. (b) Doubling time of each strain was determined from three independent replicates. Statistical analyses were performed with one-way ANOVA with Tukey’s multiple comparisons test: *p<0.05; **p<0.01; ***p<0.001; ****p<0.0001; ns, nonsignificant. (c) Spotting test of tenfold serial dilution of yeast cells of all strains on SD medium, 30°C, 48 hr, with cell wall disturbing agents (CR, Congo Red; CFW, Calcofluor White) or drugs (nikkomycin, tunicamycin, caspofungin). These results are representative of three independent experiments. Pictures were taken with a Phenobooth (Singer Instruments). (d) Filamentation assay of all strains. Top row: growth in liquid SD medium at 30°C; middle panels: growth in liquid YNB medium + 2% GlcNAc, buffered at pH 7.2 at 37°C during 6 hr. Pictures were taken using an Olympus IX 83 microscope, ×40 objective. Bottom row: cells were grown on agar YNB + 2% GlcNAc, buffered at pH 7.2, at 37°C for 6 days.
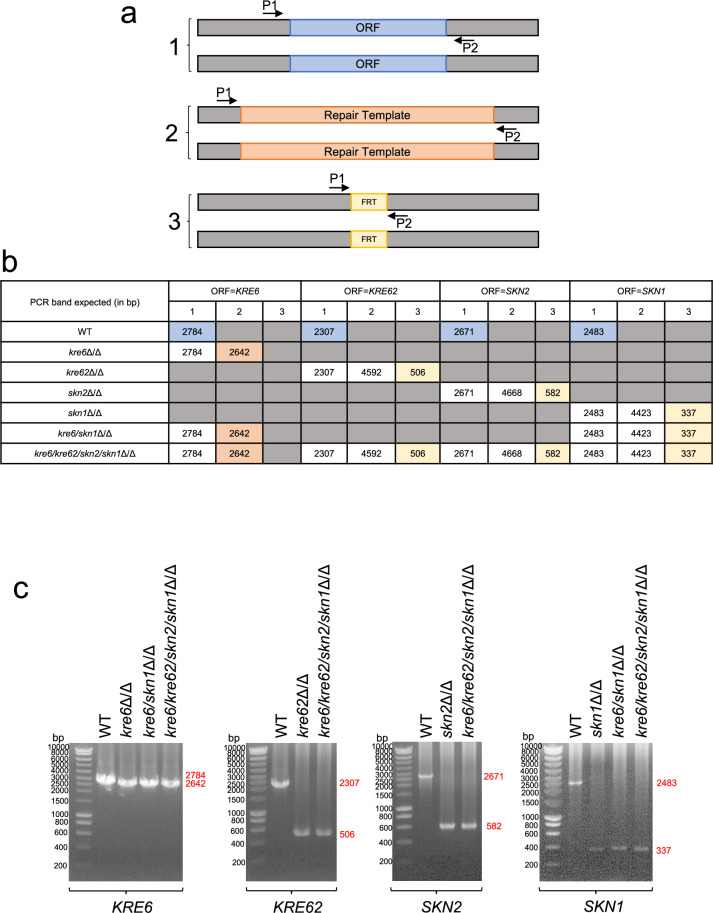
Figure 4—figure supplement 1. Control PCR control of mutants obtained in this study.
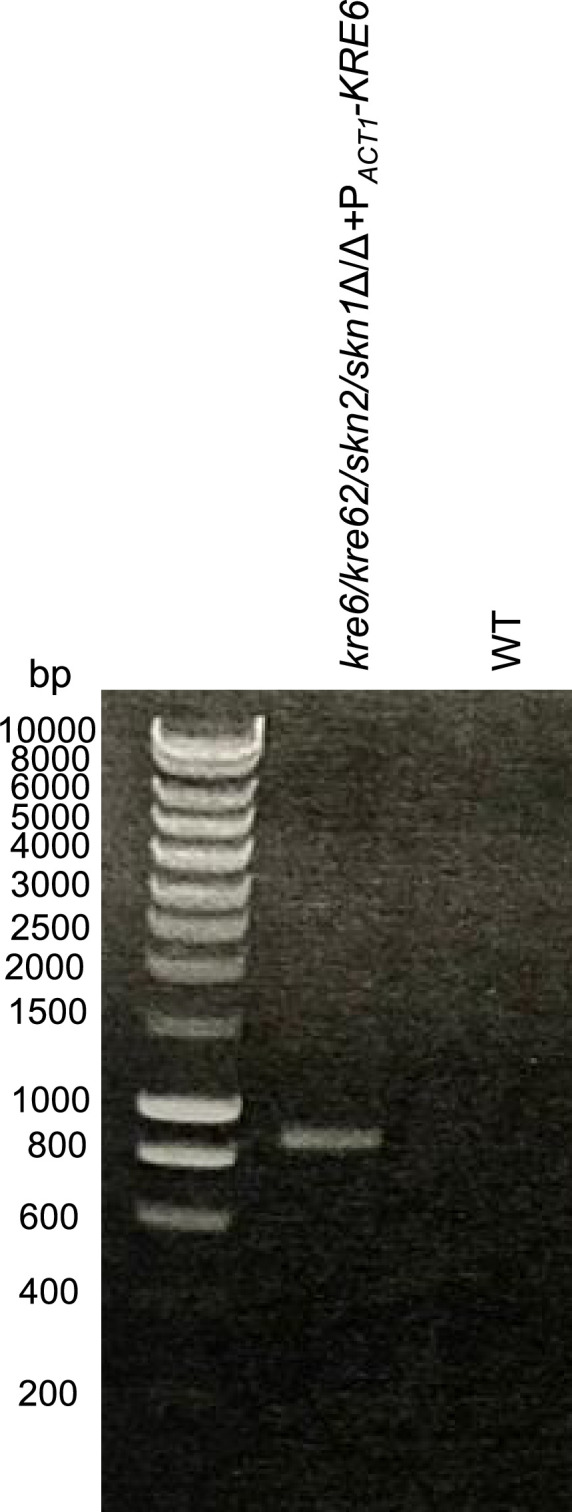
Figure 4—figure supplement 2. Control PCR of the quadruple mutant complemented for KRE6 (kre6/kre62/skn2/skn1Δ/Δ+PACT-KRE6).


