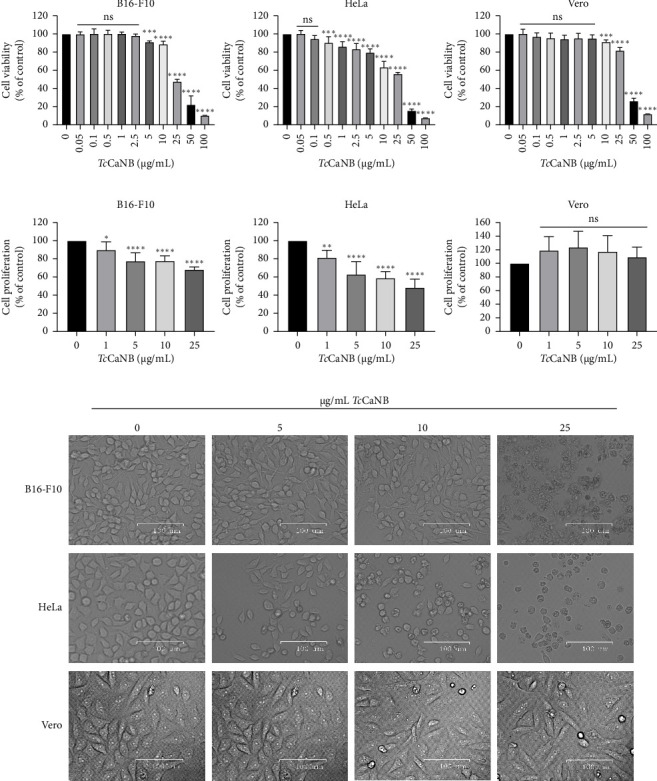
Figure 3.

In vitro cytotoxicity of TcCaNB in B16-F10, HeLa, and Vero cells. (a) Cell viability after 24 h of treatment with different concentrations of TcCaNB in different tumor cells (B16-F10 and HeLa cells). Cell viability was determined by the MTS assay. Vero cells were included as normal cells. Results were expressed as average of triplicate ± SD (n = 7, one-way ANOVA and Dunnett's test, ∗∗p < 0.01; ∗∗∗∗p < 0.0001). Asterisks show statistical differences between TcCaNB concentrations against control (0 μg/mL TcCaNB). (b) Cell proliferation after 24 h of treatment with different concentrations of TcCanB. Cell proliferation was evaluated with the CyQUANT kit. Results were expressed as average of triplicate ± SD (n = 7, one-way ANOVA and Dunnett's, ∗p < 0.05; ∗∗p < 0.01; ∗∗∗∗p < 0.0001; ns: not significant). Asterisks show statistical differences for the different TcCaNB concentrations with the control. (c) Cell morphology visualized by phase contrast of different cells tested, after 24 h of treatment with different concentrations of TcCaNB. Scale bar, 100 μm.
