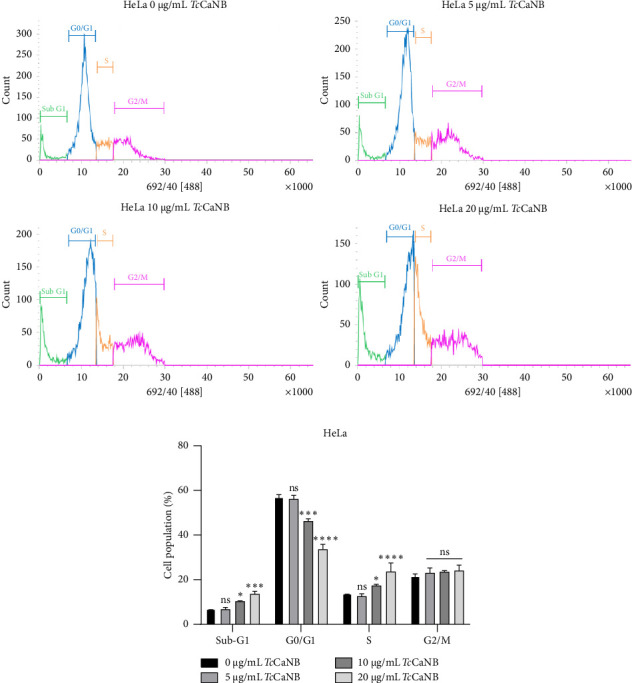
Figure 6.

Cell cycle distribution assessed by flow cytometry in TcCaNB-stimulated HeLa cells. (a) Cell cycle analysis of HeLa cells after 24 h of TcCaNB treatment (0, 5, 10, and 20 μg/mL). (b) Quantification of the cell cycle analysis. Results were expressed as average of triplicates ± SD (two-way ANOVA and Dunnett's test, ∗p < 0.05; ∗∗∗p < 0.001; ∗∗∗∗p < 0.0001; ns: not significant). Asterisks show statistical differences between TcCaNB concentrations against control (0 μg/mL TcCaNB) in each phase of the cell cycle.
